Authors
Summary
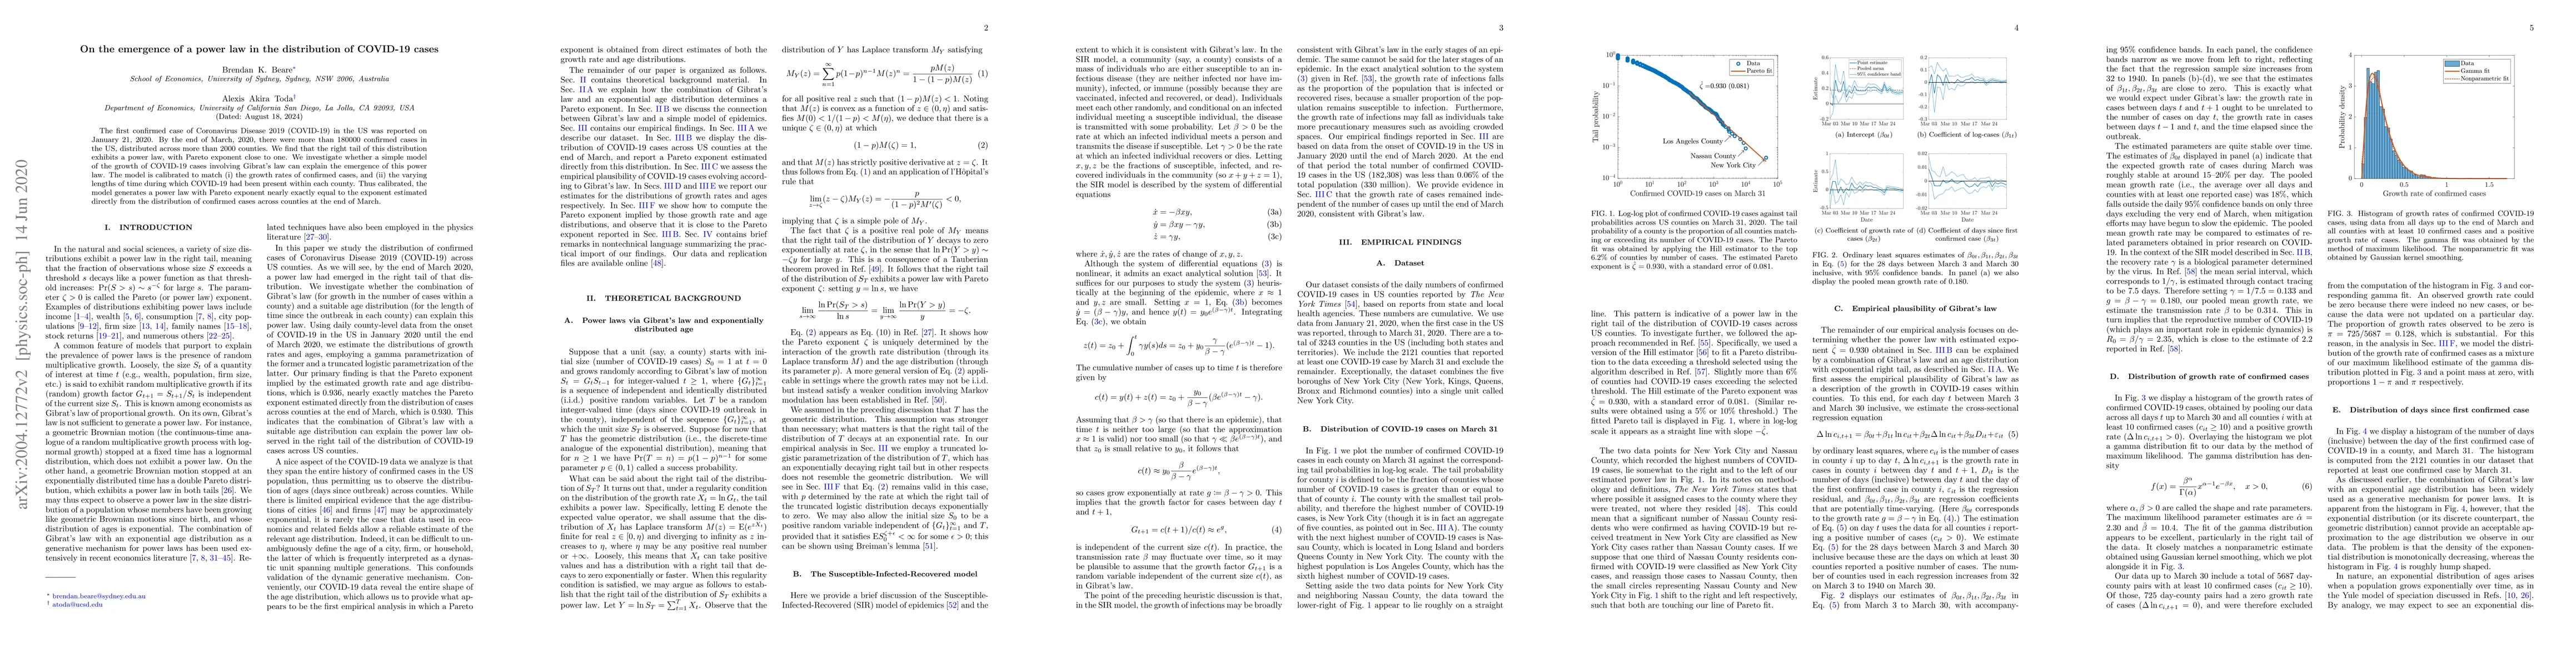
The first confirmed case of Coronavirus Disease 2019 (COVID-19) in the US was reported on January 21, 2020. By the end of March, 2020, there were more than 180000 confirmed cases in the US, distributed across more than 2000 counties. We find that the right tail of this distribution exhibits a power law, with Pareto exponent close to one. We investigate whether a simple model of the growth of COVID-19 cases involving Gibrat's law can explain the emergence of this power law. The model is calibrated to match (i) the growth rates of confirmed cases, and (ii) the varying lengths of time during which COVID-19 had been present within each county. Thus calibrated, the model generates a power law with Pareto exponent nearly exactly equal to the exponent estimated directly from the distribution of confirmed cases across counties at the end of March.
AI Key Findings
Get AI-generated insights about this paper's methodology, results, and significance.
Paper Details
PDF Preview
Key Terms
Citation Network
Current paper (gray), citations (green), references (blue)
Display is limited for performance on very large graphs.
Similar Papers
Found 4 papersUniversal behavior of the Covid-19 tails: Inverse power-law distribution
E. Aydiner, E. Yilmaz
The power-law distribution in the geometrically growing system: Statistic of the COVID-19 pandemic
Chol-Jun Kim
| Title | Authors | Year | Actions |
|---|
Comments (0)