Optimal consumption under loss-averse multiplicative habit-formation preferences
Publication
Metrics
AI Quick Summary
This paper explores optimal consumption strategies for agents with loss-averse multiplicative habit formation preferences over an infinite horizon, using an S-shaped utility function for consumption relative to habit. It analyzes the Hamilton-Jacobi-Bellman equation and derives optimal consumption and investment policies, with numerical examples illustrating their financial implications.
Paper Preview
Abstract
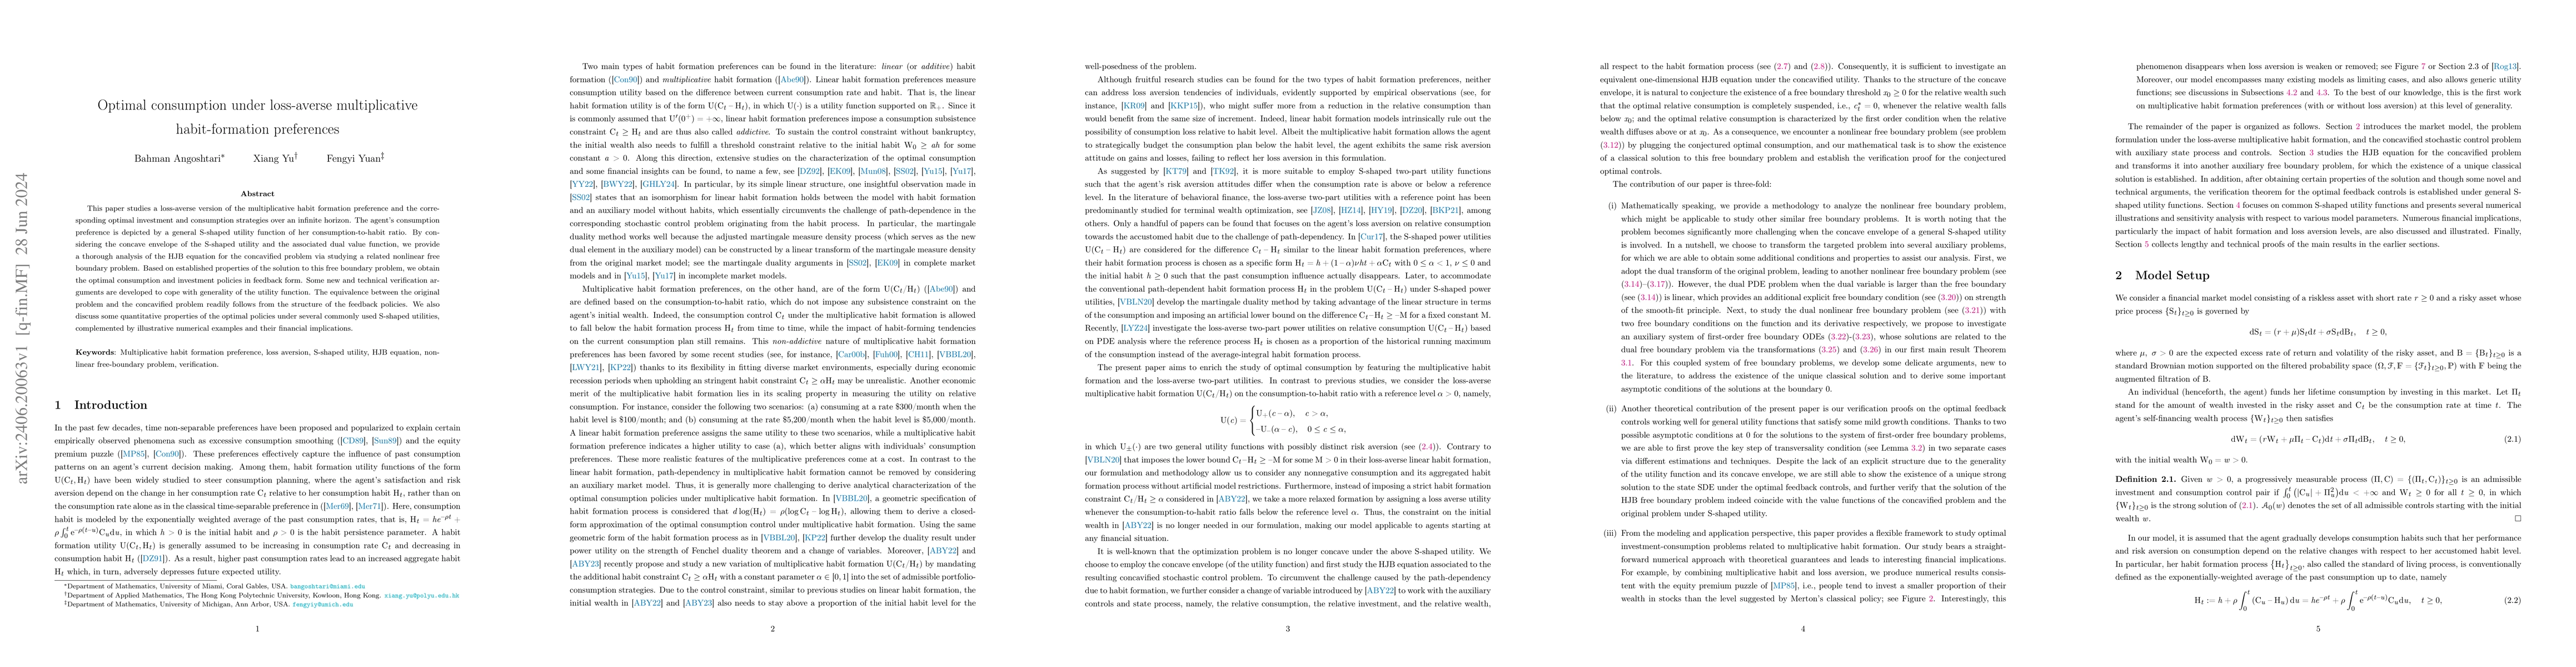
This paper studies a loss-averse version of the multiplicative habit formation preference and the corresponding optimal investment and consumption strategies over an infinite horizon. The agent's consumption preference is depicted by a general S-shaped utility function of her consumption-to-habit ratio. By considering the concave envelope of the S-shaped utility and the associated dual value function, we provide a thorough analysis of the HJB equation for the concavified problem via studying a related nonlinear free boundary problem. Based on established properties of the solution to this free boundary problem, we obtain the optimal consumption and investment policies in feedback form. Some new and technical verification arguments are developed to cope with generality of the utility function. The equivalence between the original problem and the concavified problem readily follows from the structure of the feedback policies. We also discuss some quantitative properties of the optimal policies under several commonly used S-shaped utilities, complemented by illustrative numerical examples and their financial implications.
AI Key Findings
Get AI-generated insights about this paper's methodology, results, significance, and more — seven facets brought into focus.
Impact
Paper Details
Authors
PDF Preview
Key Terms
Citation Network
Current paper (gray), citations (green), references (blue)
Display is limited for performance on very large graphs.
Discussion 0