Publication
Metrics
AI Quick Summary
This paper introduces a novel portfolio model using Weighted Value at Risk (WVAR) as a risk measure, distinct from traditional methods due to its independence from income distribution. The study employs MATLAB and historical simulation, focusing on the U.S. Nasdaq Composite Index. It proposes a WVAR-based portfolio selection method, incorporating Analytic Hierarchy Process (AHP) for indicator weights, and presents a nonlinear satisfaction portfolio model. The research compares the performance of WVAR-based portfolios to Mean-Weighted V@R and Mean-Variance models using ETF data, suggesting WVAR offers unique advantages in risk description and optimization.
Paper Preview
Abstract
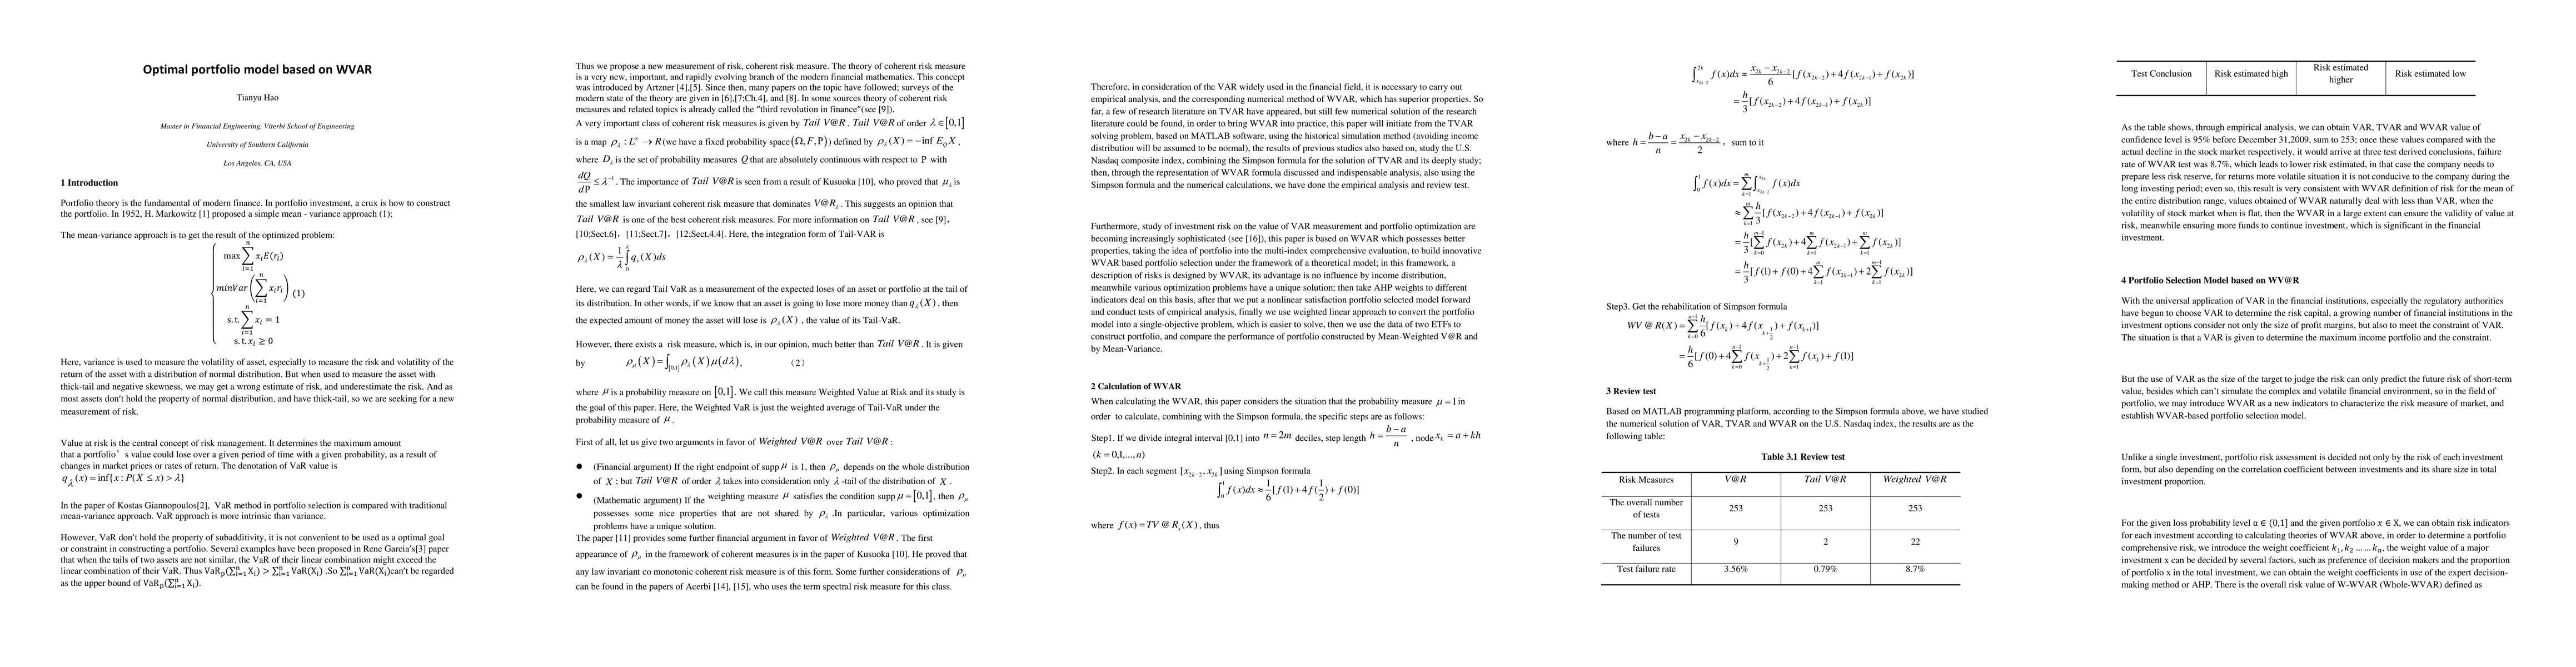
This article is focused on using a new measurement of risk-- Weighted Value at Risk to develop a new method of constructing initiate from the TVAR solving problem, based on MATLAB software, using the historical simulation method (avoiding income distribution will be assumed to be normal), the results of previous studies also based on, study the U.S. Nasdaq composite index, combining the Simpson formula for the solution of TVAR and its deeply study; then, through the representation of WVAR formula discussed and indispensable analysis, also using the Simpson formula and the numerical calculations, we have done the empirical analysis and review test. this paper is based on WVAR which possesses better properties, taking the idea of portfolio into the multi-index comprehensive evaluation, to build innovative WVAR based portfolio selection under the framework of a theoretical model; in this framework, a description of risks is designed by WVAR, its advantage is no influence by income distribution, meanwhile various optimization problems have a unique solution; then take AHP weights to different indicators deal on this basis, after that we put a nonlinear satisfaction portfolio selected model forward and conduct tests of empirical analysis, finally we use weighted linear approach to convert the portfolio model into a single-objective problem, which is easier to solve, then we use the data of two ETFs to construct portfolio, and compare the performance of portfolio constructed by Mean-Weighted V@R and by Mean-Variance.
AI Key Findings
Get AI-generated insights about this paper's methodology, results, significance, and more — seven facets brought into focus.
Impact
Paper Details
PDF Preview
Key Terms
Citation Network
Current paper (gray), citations (green), references (blue)
Display is limited for performance on very large graphs.
Discussion 0