Outlier detection and a tail-adjusted boxplot based on extreme value theory
Publication
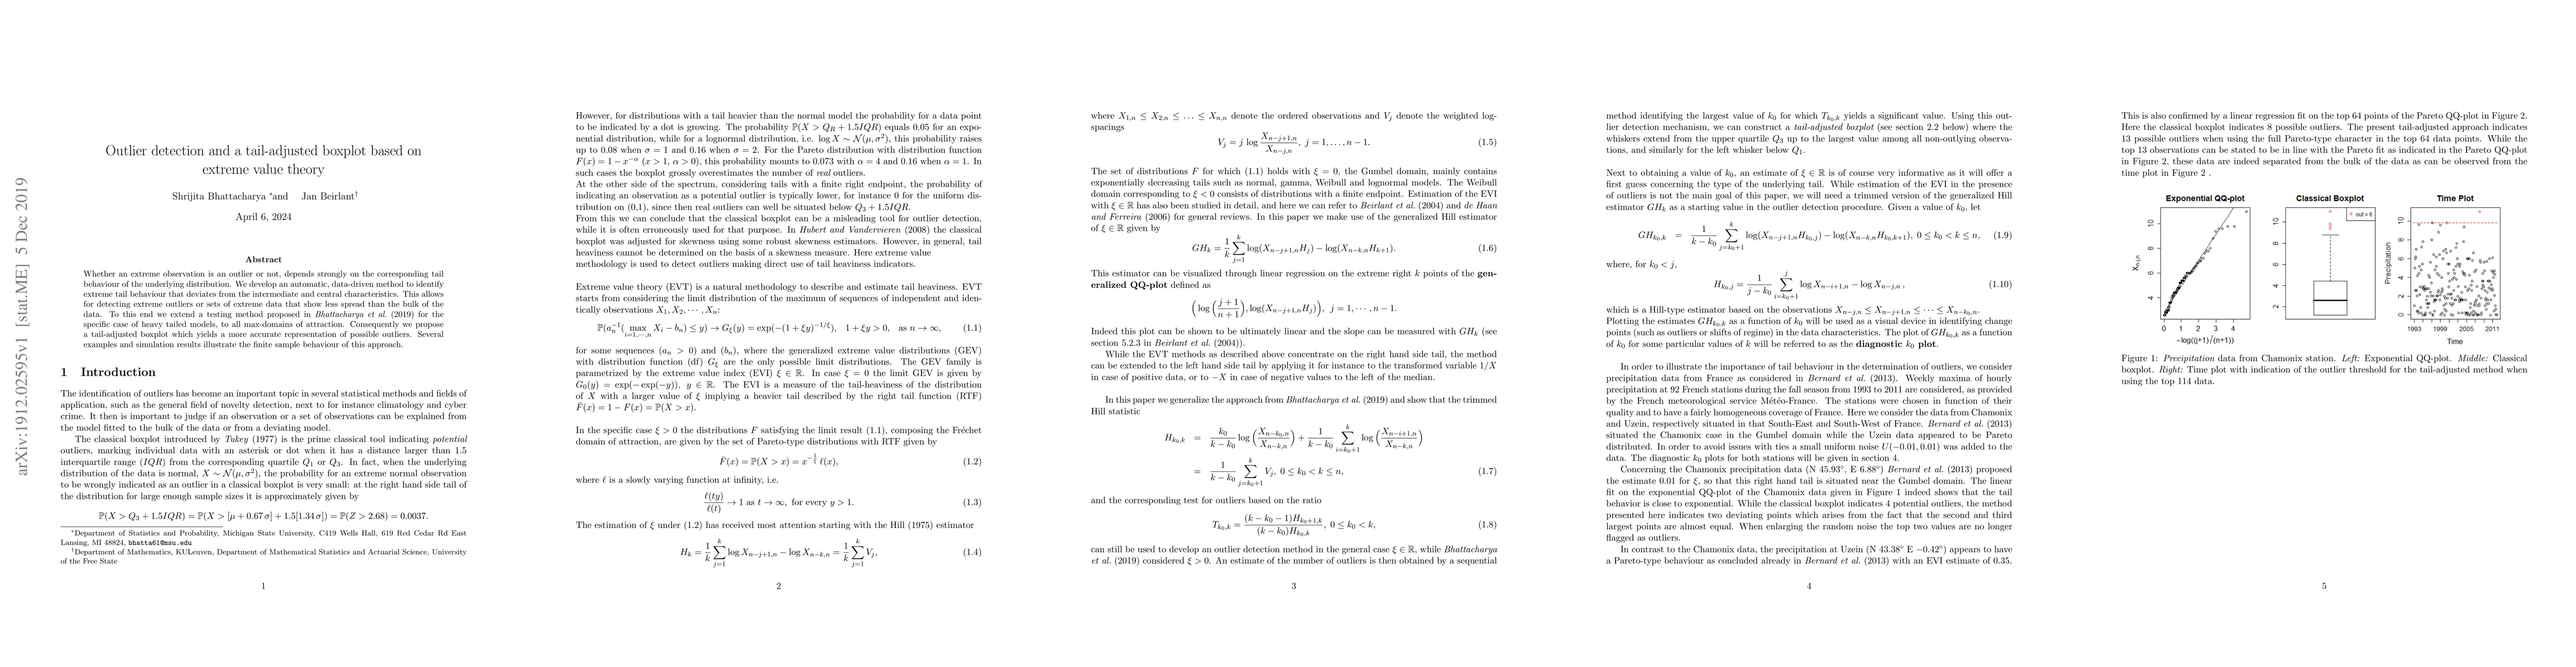
Metrics
Paper Preview
Abstract
Whether an extreme observation is an outlier or not, depends strongly on the corresponding tail behaviour of the underlying distribution. We develop an automatic, data-driven method to identify extreme tail behaviour that deviates from the intermediate and central characteristics. This allows for detecting extreme outliers or sets of extreme data that show less spread than the bulk of the data. To this end we extend a testing method proposed in Bhattacharya et al 2019 for the specific case of heavy tailed models, to all max-domains of attraction. Consequently we propose a tail-adjusted boxplot which yields a more accurate representation of possible outliers. Several examples and simulation results illustrate the finite sample behaviour of this approach.
AI Key Findings
Get AI-generated insights about this paper's methodology, results, significance, and more — seven facets brought into focus.
Impact
Paper Details
Authors
PDF Preview
Key Terms
Citation Network
Current paper (gray), citations (green), references (blue)
Display is limited for performance on very large graphs.
Discussion 0