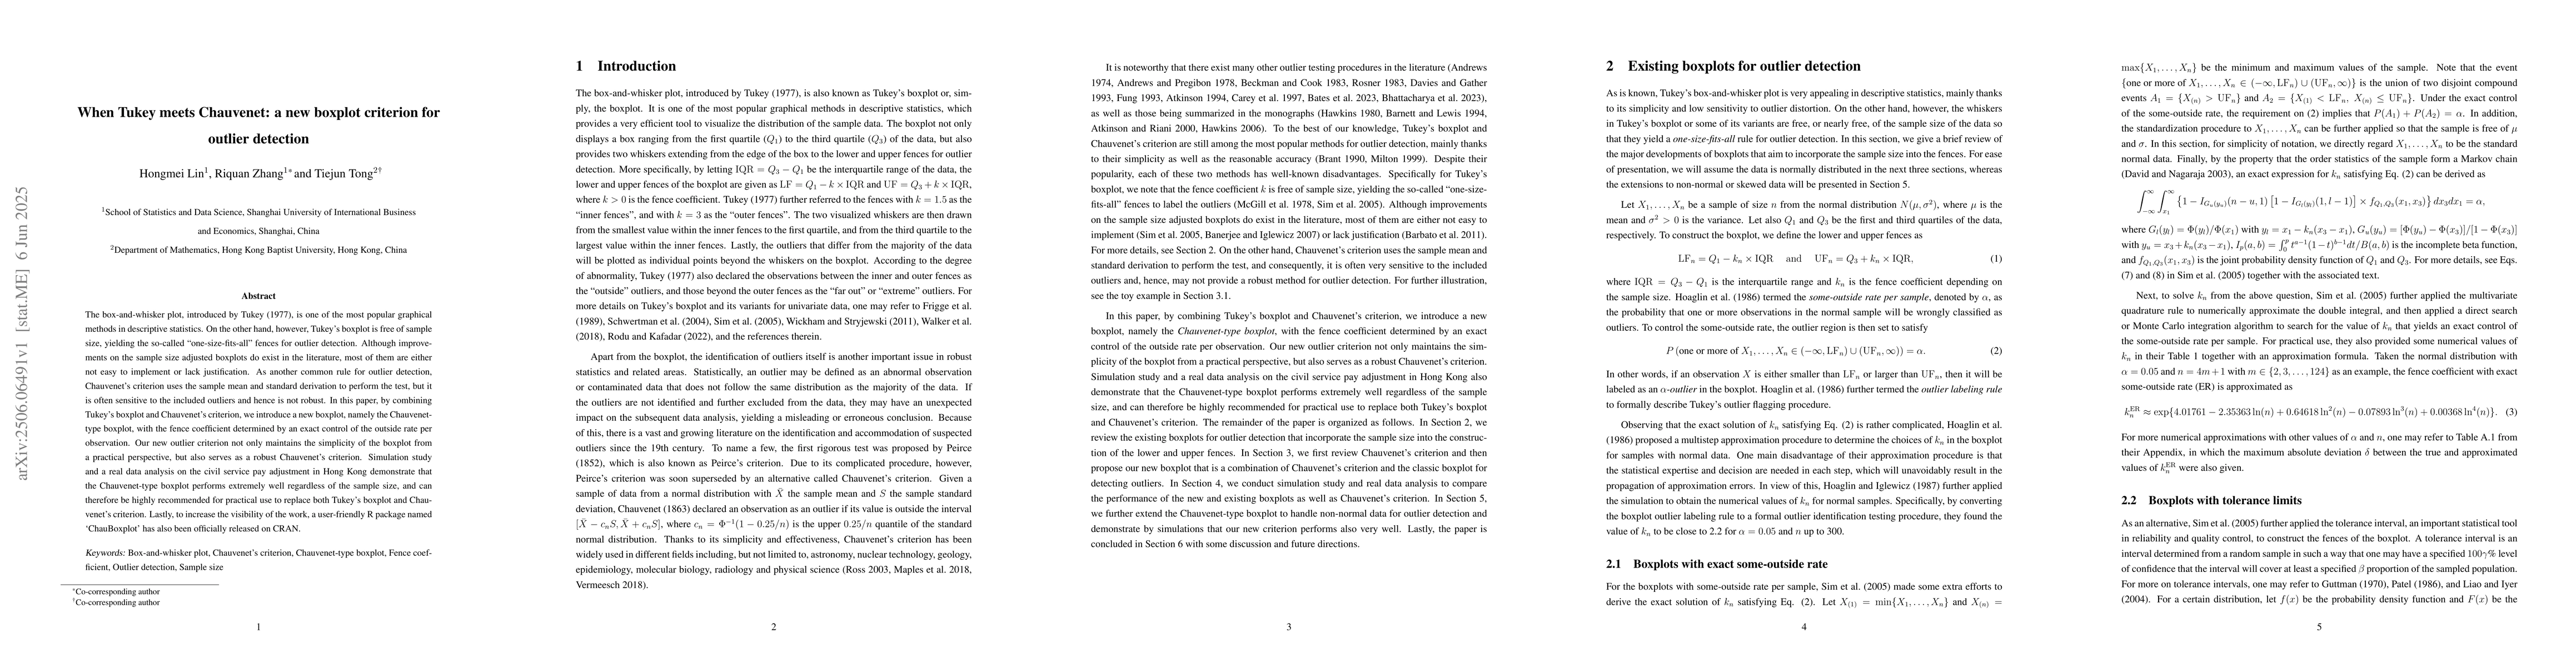
The box-and-whisker plot, introduced by Tukey (1977), is one of the most popular graphical methods in descriptive statistics. On the other hand, however, Tukey's boxplot is free of sample size, yielding the so-called "one-size-fits-all" fences for outlier detection. Although improvements on the sample size adjusted boxplots do exist in the literature, most of them are either not easy to implement or lack justification. As another common rule for outlier detection, Chauvenet's criterion uses the sample mean and standard derivation to perform the test, but it is often sensitive to the included outliers and hence is not robust. In this paper, by combining Tukey's boxplot and Chauvenet's criterion, we introduce a new boxplot, namely the Chauvenet-type boxplot, with the fence coefficient determined by an exact control of the outside rate per observation. Our new outlier criterion not only maintains the simplicity of the boxplot from a practical perspective, but also serves as a robust Chauvenet's criterion. Simulation study and a real data analysis on the civil service pay adjustment in Hong Kong demonstrate that the Chauvenet-type boxplot performs extremely well regardless of the sample size, and can therefore be highly recommended for practical use to replace both Tukey's boxplot and Chauvenet's criterion. Lastly, to increase the visibility of the work, a user-friendly R package named `ChauBoxplot' has also been officially released on CRAN.
Get AI-generated insights about this paper's methodology, results, and significance.
Current paper (gray), citations (green), references (blue)
D. E. Reichart, C. P. Salemi, M. P. Maples et al.
Daniel E. Reichart, Nicholas Konz
No citations found for this paper.
Title | Authors | Year | Actions |
---|---|---|---|
Outlier detection based on extreme value theory and applications
|
Shrijita Bhattacharya, Francois Kamper, J. Beirlant
|
2023
|
View Paper |
Boxplot fences in proficiency testing
|
Clara Morales, Ramón Giraldo, Marta Torres
|
2021
|
View Paper |
The q–q Boxplot
|
Jordan Rodu, K. Kafadar
|
2021
|
View Paper |
Testing for outliers with conformal p-values
|
Stephen Bates, E. Candès, Lihua Lei, Yaniv Romano, Matteo Sesia
|
2021
|
View Paper |
Sparse Functional Boxplots for Multivariate Curves
|
Zhuo Qu, M. Genton
|
2021
|
View Paper |
A Robust Skewed Boxplot for Detecting Outliers in Rainfall Observations in Real-Time Flood Forecasting
|
Chao Zhao, Jinyan Yang
|
2019
|
View Paper |
A boxplot for circular data
|
Davide Buttarazzi, Giuseppe Pandolfo, G. C. Porzio
|
2018
|
View Paper |
An Improved Boxplot for Univariate Data
|
M. Walker, Y. H. Dovoedo, S. Chakraborti, C. W. Hilton
|
2018
|
View Paper |
Robust Chauvenet Outlier Rejection
|
M. Maples, D. Reichart, N. Konz, T. Berger, A. Trotter, J. R. Martin, D. A. Dutton, M. Paggen, R. Joyner, C. Salemi
|
2018
|
View Paper |
IsoplotR: A free and open toolbox for geochronology
|
P. Vermeesch
|
2018
|
View Paper |
Letter-Value Plots: Boxplots for Large Data
|
H. Hofmann, H. Wickham, K. Kafadar
|
2017
|
View Paper |
Path Boxplots: A Method for Characterizing Uncertainty in Path Ensembles on a Graph
|
Mukund Raj, M. Mirzargar, R. Ricci, R. Kirby, R. Whitaker
|
2017
|
View Paper |
A Comparative Study of Outliers Identification Methods in Univariate Data Set
|
Shein Wong Hui, Fitrianto Anwar
|
2017
|
View Paper |
Boxplot-Based Outlier Detection for the Location-Scale Family
|
Y. H. Dovoedo, S. Chakraborti
|
2015
|
View Paper |
A generalized boxplot for skewed and heavy-tailed distributions
|
C. Bruffaerts, Vincenzo Verardi, Catherine Vermandele
|
2014
|
View Paper |
Curve Boxplot: Generalization of Boxplot for Ensembles of Curves
|
M. Mirzargar, R. Whitaker, R. Kirby
|
2014
|
View Paper |
Contour Boxplots: A Method for Characterizing Uncertainty in Feature Sets from Simulation Ensembles
|
R. Whitaker, M. Mirzargar, R. Kirby
|
2013
|
View Paper |
Boxplot for circular variables
|
A. Abuzaid, I. Mohamed, A. G. Hussin
|
2012
|
View Paper |
Features and performance of some outlier detection methods
|
G. Barbato, E. Barini, Gianfranco Genta, R. Levi
|
2011
|
View Paper |
Functional Boxplots
|
Ying Sun, M. Genton
|
2011
|
View Paper |
Cochrane Handbook for Systematic Reviews of Interventions
|
Julian P T Higgins, Sally Green
|
2010
|
View Paper |
Rainbow Plots, Bagplots, and Boxplots for Functional Data
|
Rob J Hyndman, H. Shang
|
2010
|
View Paper |
An adjusted boxplot for skewed distributions
|
M. Hubert, E. Vandervieren
|
2008
|
View Paper |
On Fences and Asymmetry in Box-and-Whiskers Plots
|
L. Dümbgen, H. Riedwyl
|
2007
|
View Paper |
Identifying outliers with sequential fences
|
N. Schwertman, R. D. Silva
|
2007
|
View Paper |
A Simple Univariate Outlier Identification Procedure Designed for Large Samples
|
S. Banerjee, B. Iglewicz
|
2007
|
View Paper |
Outlier Labeling With Boxplot Procedures
|
C. H Sim, F. F. Gan, T. C. Chang
|
2005
|
View Paper |
A simple more general boxplot method for identifying outliers
|
N. Schwertman, M. Owens, Robiah Adnan
|
2004
|
View Paper |
Resistant outlier rules and the non-Gaussian case
|
K. Carling
|
1998
|
View Paper |
Resistant and test-based outlier rejection: effects on Gaussian one- and two-sample inference
|
V. Carey, C. Wager, E. Walters, B. Rosner
|
1997
|
View Paper |
Fast Very Robust Methods for the Detection of Multiple Outliers
|
A. Atkinson
|
1994
|
View Paper |
The Three Sigma Rule
|
F. Pukelsheim
|
1994
|
View Paper |
Unmasking Outliers and Leverage Points: A Confirmation
|
W. Fung
|
1993
|
View Paper |
Comparing Classical and Resistant Outlier Rules
|
R. Brant
|
1990
|
View Paper |
Fine-Tuning Some Resistant Rules for Outlier Labeling
|
D. Hoaglin, B. Iglewicz
|
1987
|
View Paper |
Performance of Some Resistant Rules for Outlier Labeling
|
D. Hoaglin, B. Iglewicz, J. Tukey
|
1986
|
View Paper |
Percentage Points for a Generalized ESD Many-Outlier Procedure
|
B. Rosner
|
1983
|
View Paper |
Statistical Methods in the Biological and Health Sciences
|
Bob Rosenfeld, J. S. Milton, J. Tsokos
|
1982
|
View Paper |
Finding the Outliers that Matter
|
D. Andrews, D. Pregibon
|
1978
|
View Paper |
Variations of Box Plots
|
R. McGill, J. Tukey, W. A. Larsen
|
1978
|
View Paper |
A Robust Method for Multiple Linear Regression
|
D. Andrews
|
1974
|
View Paper |
Statistical Tolerance Regions: Classical and Bayesian
|
J. Ord
|
1971
|
View Paper |
On Peirce's Criterion for the Rejection of Doubtful Observations, with tables for facilitating its application
|
B. A. Gould
|
1855
|
View Paper |
Criterion for the rejection of doubtful observations
|
B. Peirce
|
1852
|
View Paper |
Statistical Inference
|
Guillaume Flandin
|
2012
|
View Paper |
40 years of boxplots, Technical Report
|
2011
|
||
Understanding Statistical Process Control, 3rd Edition , Knoxville
|
2010
|
||
Outlier Detection
|
Yufeng Kou, Chang-Tien Lu
|
2008
|
View Paper |
A TOLERANCE INTERVAL FOR THE NORMAL DISTRIBUTION WITH SEVERAL VARIANCE COMPONENTS
|
C. Liao, H. Iyer
|
2004
|
View Paper |
Order Statistics, 3rd Edition , New York
|
2003
|
||
A SIMPLE UNIVARIATE OUTLIER IDENTIFICATION PROCEDURE
|
B. Iglewicz, S. Banerjee
|
2001
|
View Paper |
The Identification Of Multiple Outliers
|
J. P. Park
|
2000
|
View Paper |
Exploratory data analysis for possibly censored data from skew distributions
|
1990
|
||
Some implementation of the boxplot
|
1989
|
||
Tolerance limits - a review
|
J. Patel
|
1986
|
View Paper |
Outliers..........s
|
1983
|
||
Exploratory Data Analysis , Reading, MA
|
1977
|
||
Sampling inspection in statistical quality control
|
W. C. Guenther
|
1977
|
View Paper |
A manual of spherical and practical astronomy
|
W. Chauvenet
|
1891
|
View Paper |
Peirce's Criterion
|
R. M. Stewart
|
View Paper |
Showing first page preview. Click "Open Full PDF" to view the complete paper.
Your comment contains inappropriate language and has been rejected.
Are you sure you want to remove this tag? This action cannot be undone.
Someone just found a breakthrough paper!
Comments (0)