Academic Profile
Statistics
Similar Authors
Papers on arXiv
Quantifying the heterogeneity is an important issue in meta-analysis, and among the existing measures, the $I^2$ statistic is most commonly used. In this paper, we first illustrate with a simple exa...
Difference-based methods have been attracting increasing attention in nonparametric regression, in particular for estimating the residual variance.To implement the estimation, one needs to choose an...
We consider a wireless network scenario applicable to metropolitan areas with developed public transport networks and high commute demands, where the mobile user equipments (UEs) move along fixed an...
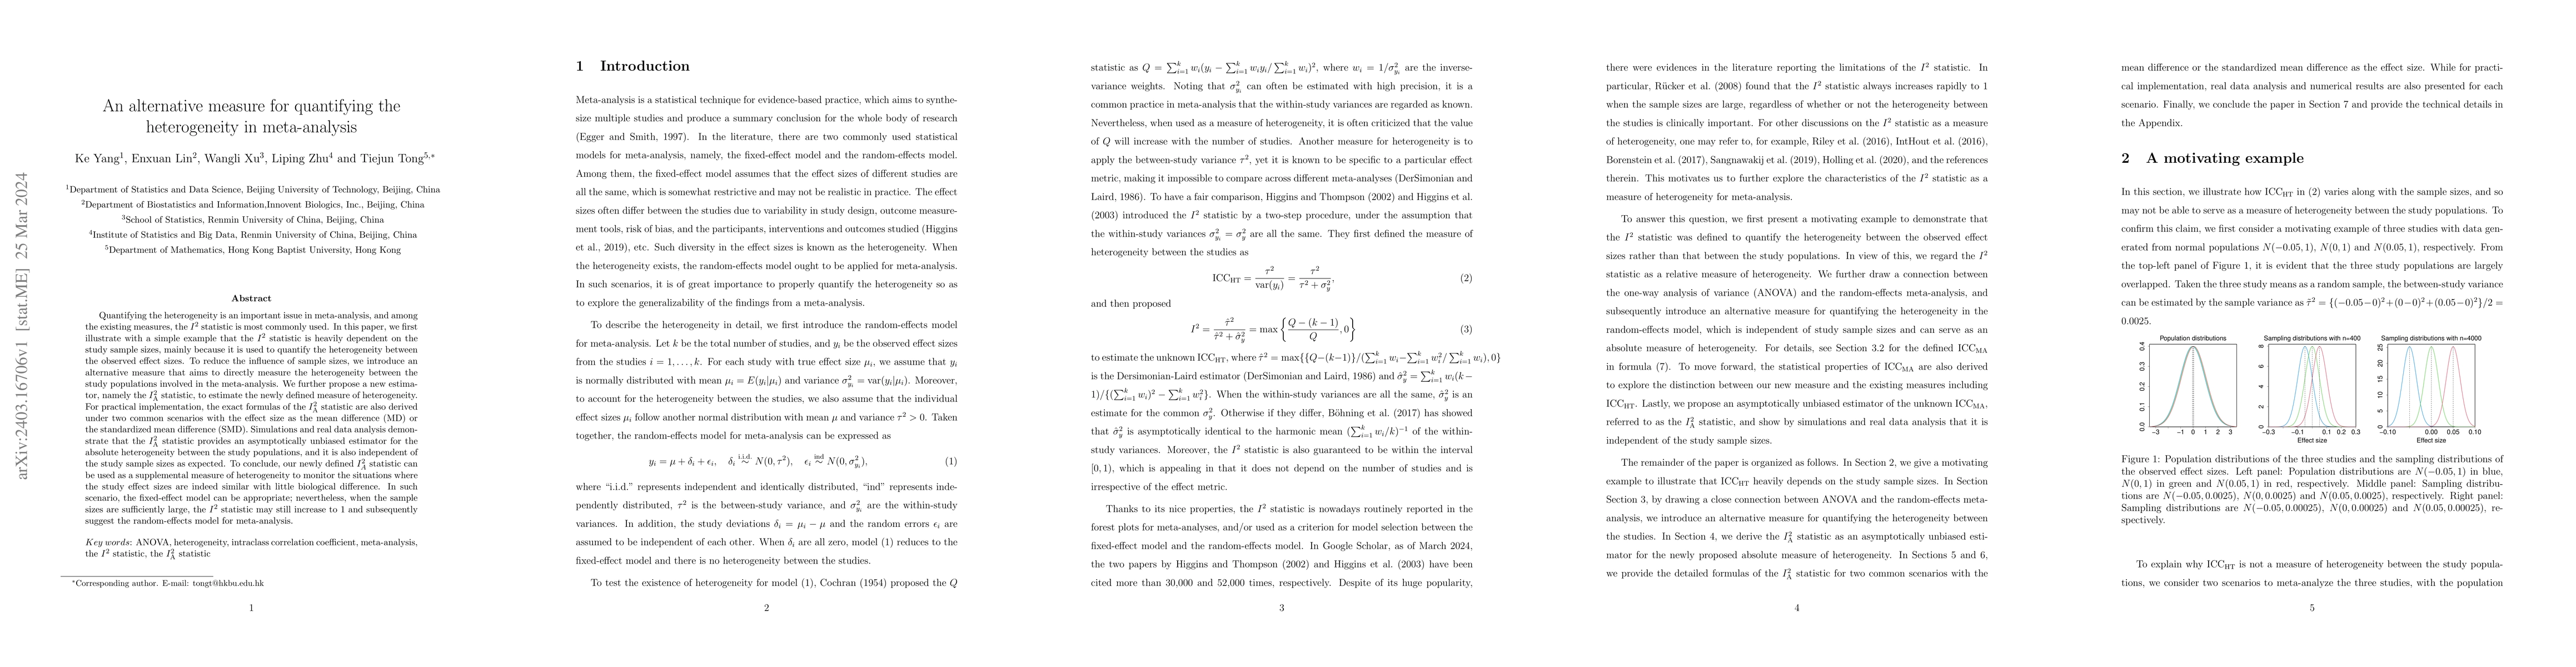
Quantifying the heterogeneity is an important issue in meta-analysis, and among the existing measures, the $I^2$ statistic is the most commonly used measure in the literature. In this paper, we show...
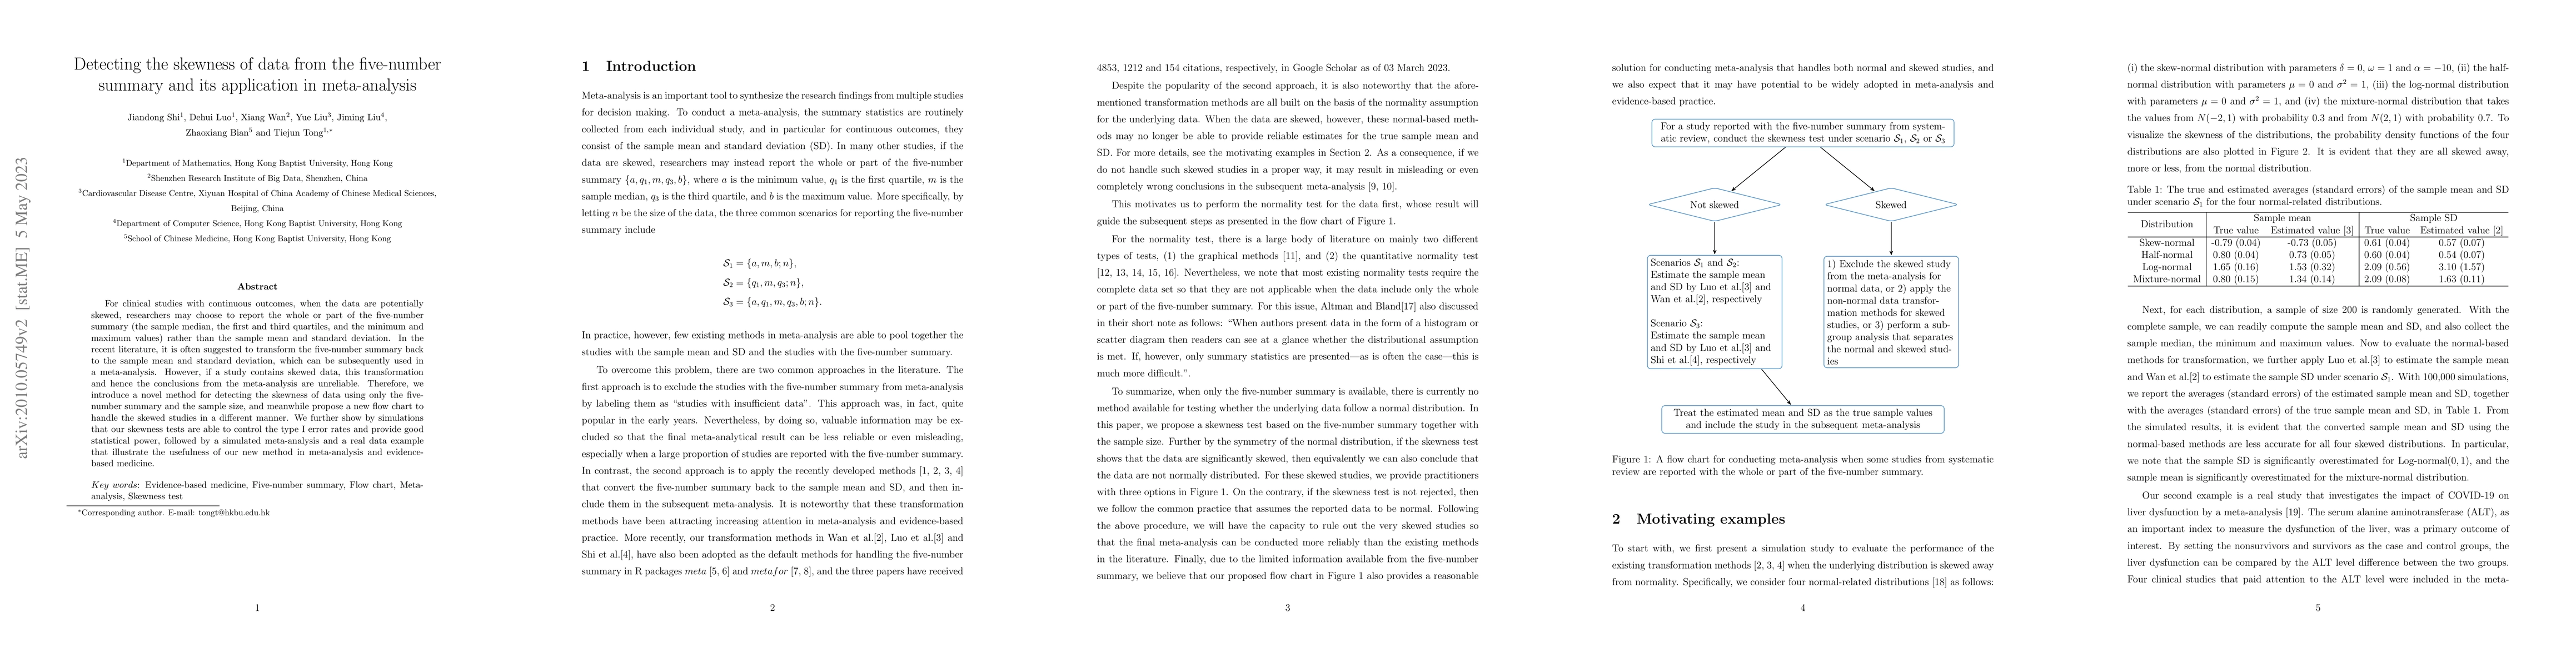
For clinical studies with continuous outcomes, when the data are potentially skewed, researchers may choose to report the whole or part of the five-number summary (the sample median, the first and t...
As a classic parameter from the binomial distribution, the binomial proportion has been well studied in the literature owing to its wide range of applications. In contrast, the reciprocal of the bin...
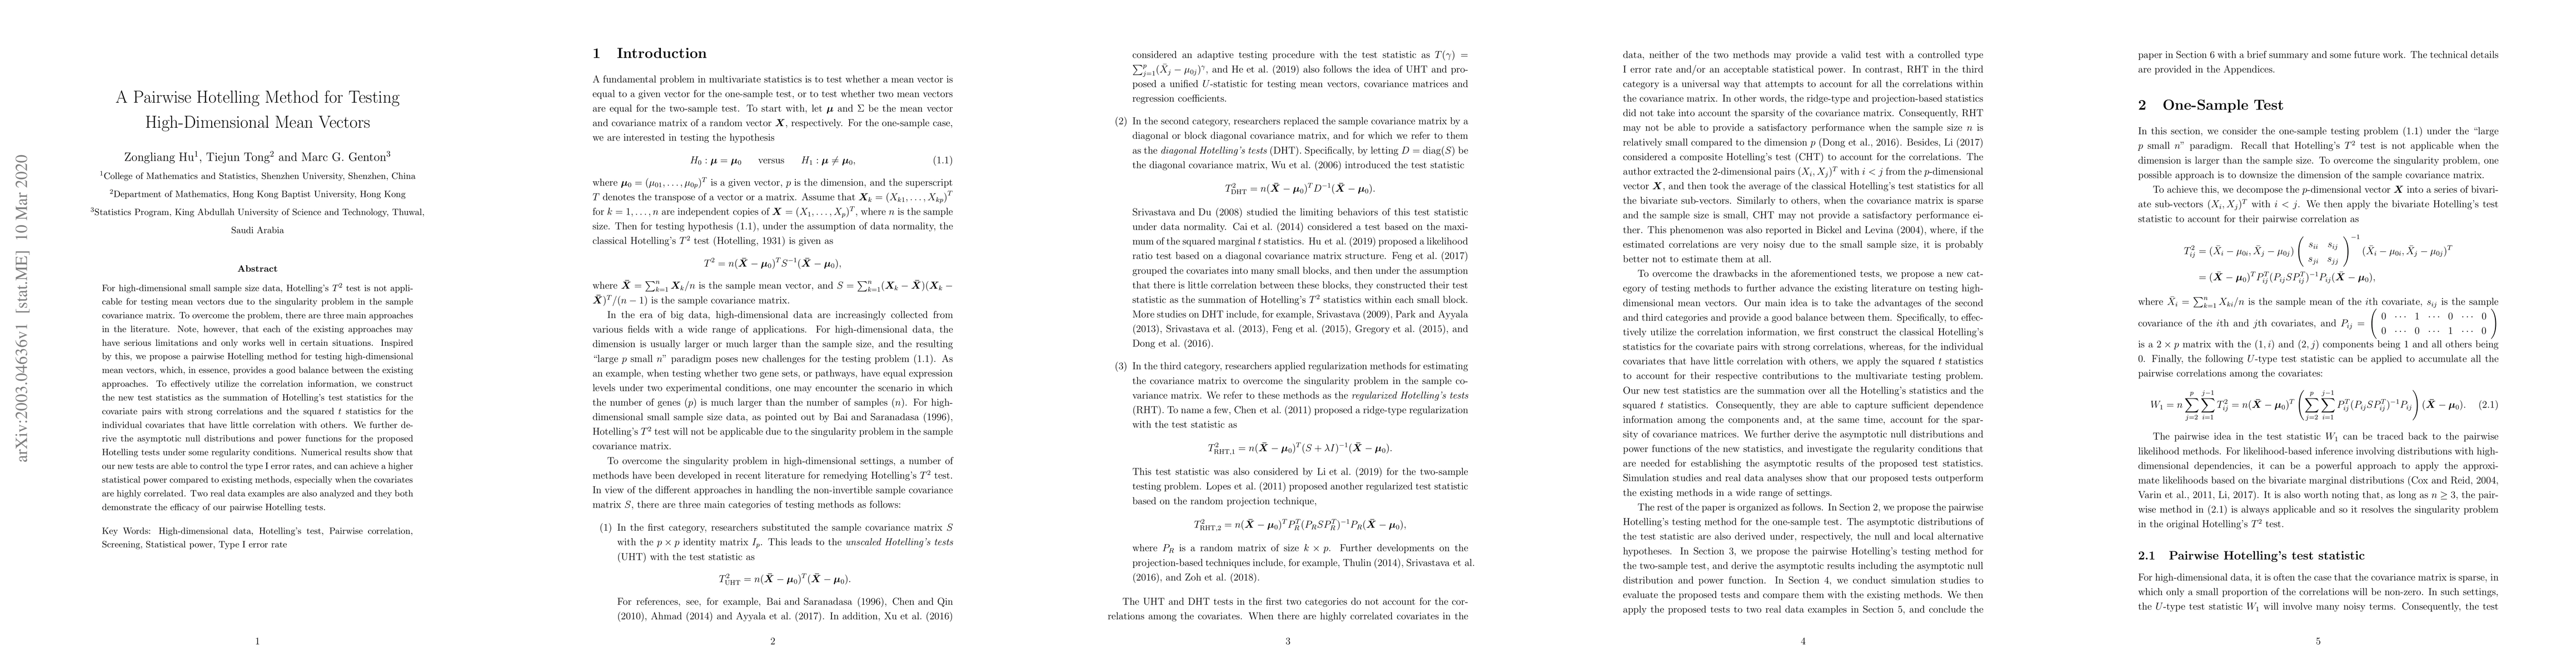
For high-dimensional small sample size data, Hotelling's T2 test is not applicable for testing mean vectors due to the singularity problem in the sample covariance matrix. To overcome the problem, t...
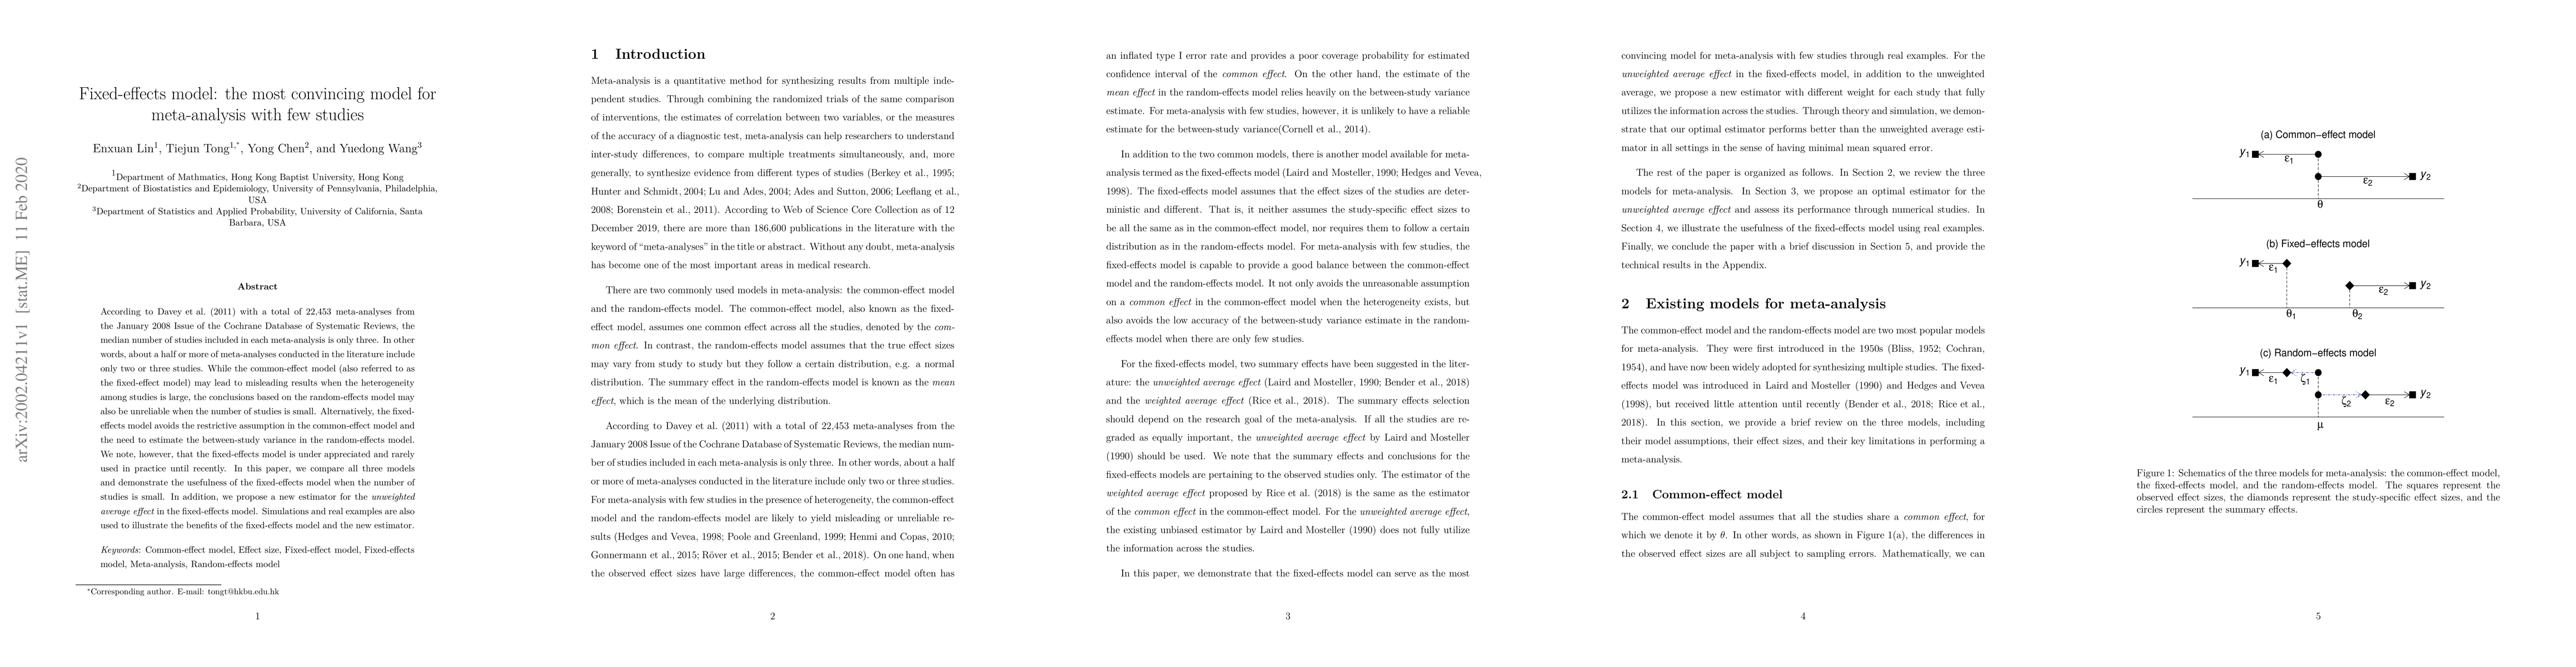
According to Davey et al. (2011) with a total of 22,453 meta-analyses from the January 2008 Issue of the Cochrane Database of Systematic Reviews, the median number of studies included in each meta-a...
Sample size calculation is crucial in biomedical in vivo research investigations mainly for two reasons: to design the most resource-efficient studies and to safeguard ethical issues when alive animal...
The standardized mean difference (SMD) is a widely used measure of effect size, particularly common in psychology, clinical trials, and meta-analysis involving continuous outcomes. Traditionally, unde...
The box-and-whisker plot, introduced by Tukey (1977), is one of the most popular graphical methods in descriptive statistics. On the other hand, however, Tukey's boxplot is free of sample size, yieldi...
Tukey's boxplot is a foundational tool for exploratory data analysis, but its classic outlier-flagging rule does not account for the sample size, and subsequent modifications have often been presented...
The bagplot, also known as the "bag-and-bolster plot", is a notable extension of the boxplot from univariate to bivariate data. Although widely used, its practical application is hindered by two key l...
Tukey's boxplot is widely used for outlier detection; however, its classic fixed-fence rule tends to flag an excessive number of outliers as the sample size grows. To address this limitation, we intro...