Palette diagram: A Python package for visualization of collective categorical data
2011.01934
Published Nov 5, 2020
1 citations
Publication
Published:
Nov 05, 2020
Updated:
Jun 16, 2025
Categories:
cs.DB, cs.GR, cs.SI
Metrics
Citations:
1
Source:
ArXiv
AI Quick Summary
The tool is designed to facilitate better understanding and analysis of categorical data, making it easier to identify patterns and trends in various fields.
Paper Preview
Abstract
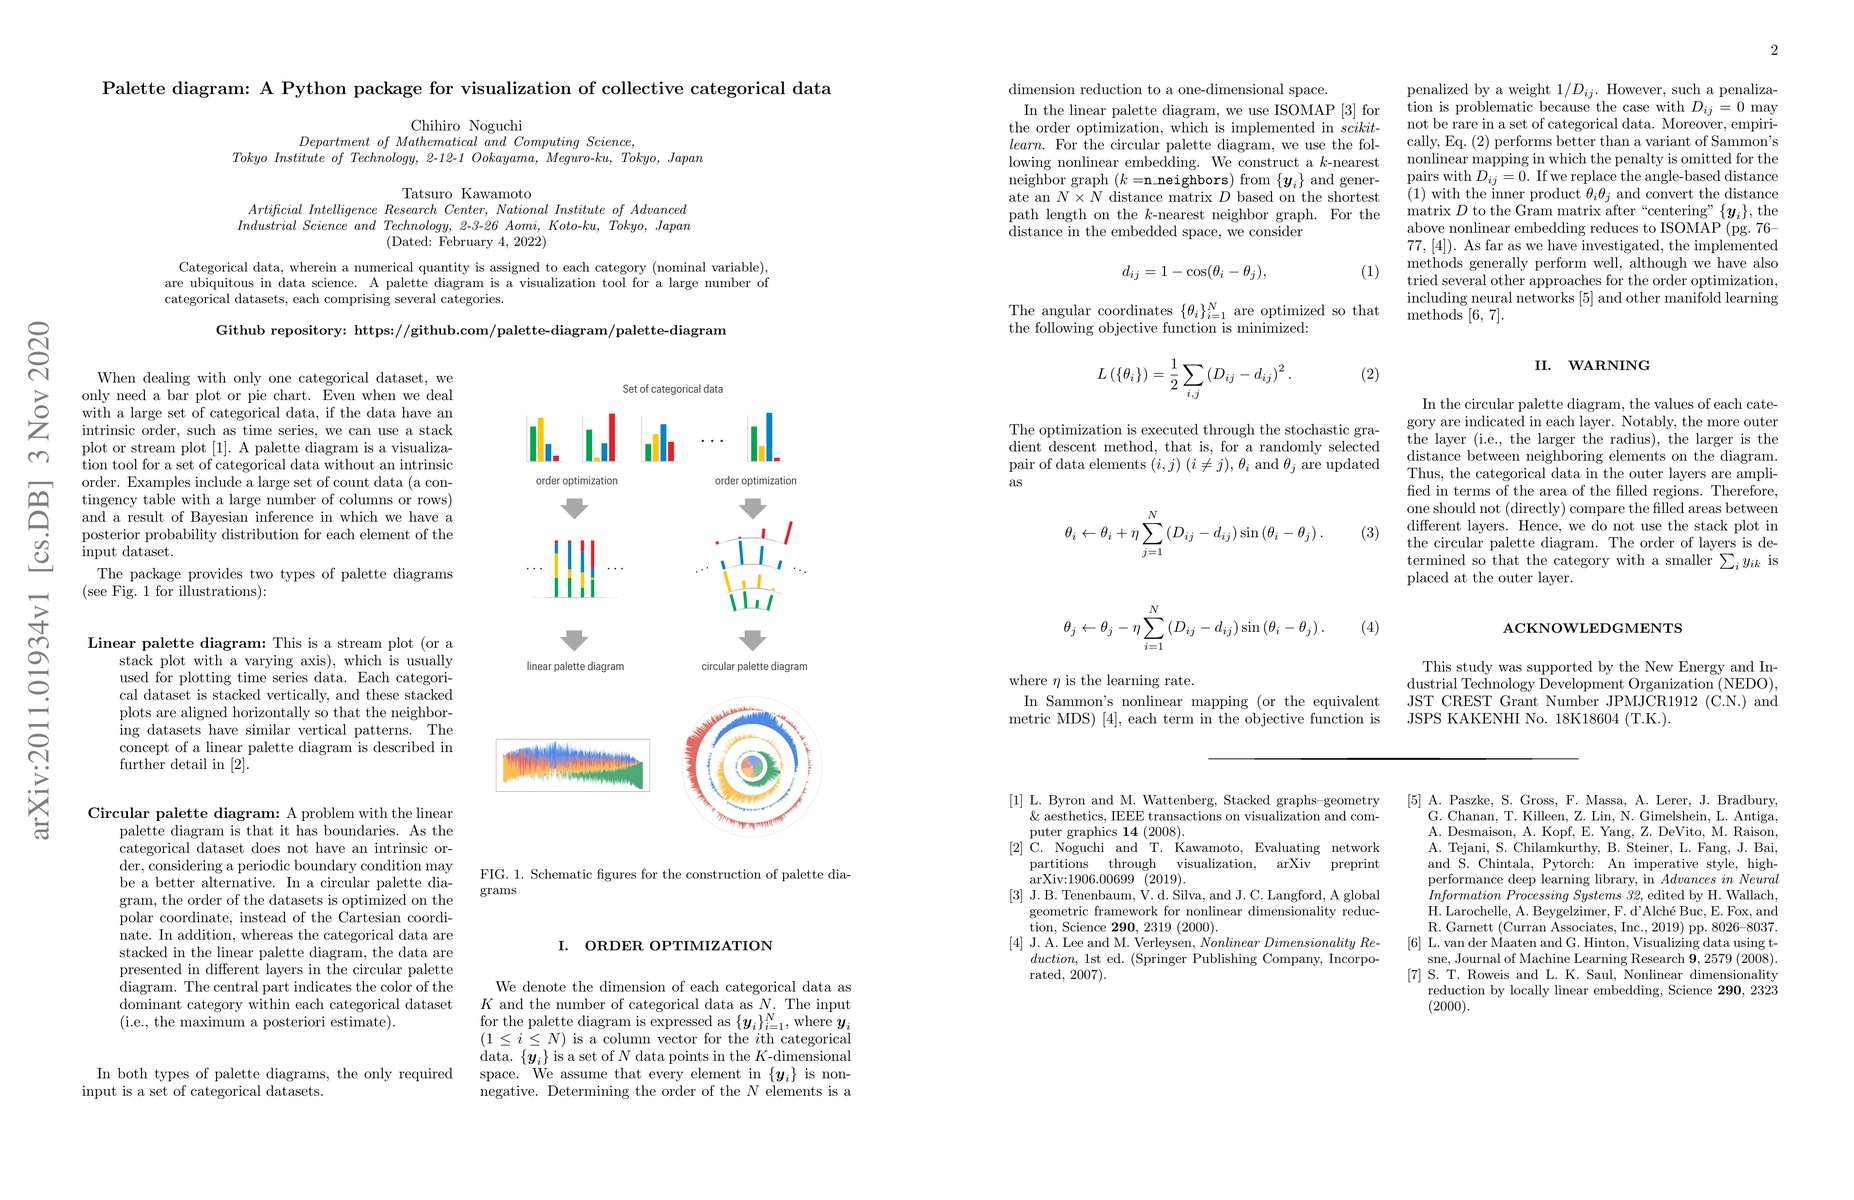
Categorical data, wherein a numerical quantity is assigned to each category (nominal variable), are ubiquitous in data science. A palette diagram is a visualization tool for a large number of categorical datasets, each comprising several categories.
AI Key Findings
Get AI-generated insights about this paper's methodology, results, significance, and more — seven facets brought into focus.
Impact
1
Citations
8
References
Paper Details
Paper ID:
2011.01934
License:
http://arxiv.org/licenses/nonexclusive-distrib/1.0/
Comments:
2 pages, 1 figure
Categories:
cs.DB
cs.GR
cs.SI
Authors
PDF Preview
Key Terms
nominal
(0.333)
ubiquitous
(0.308)
assigned
(0.308)
nominal
(0.303)
quantity
(0.294)
assigned
(0.294)
visualization
(0.288)
comprising
(0.283)
Citation Network
Current paper (gray), citations (green), references (blue)
Display is limited for performance on very large graphs.
Current Paper
Citations
References
Click to view
Discussion 0