Diceplot: A package for high dimensional categorical data visualization
Publication
Metrics
AI Quick Summary
Diceplot is an R package and Python library designed for visualizing high-dimensional categorical data, offering Dice plots for up to four classes and Domino plots for binary comparisons, facilitating intuitive pathway analysis. The tool is accessible via R, pip, and GitHub.
Paper Preview
Abstract
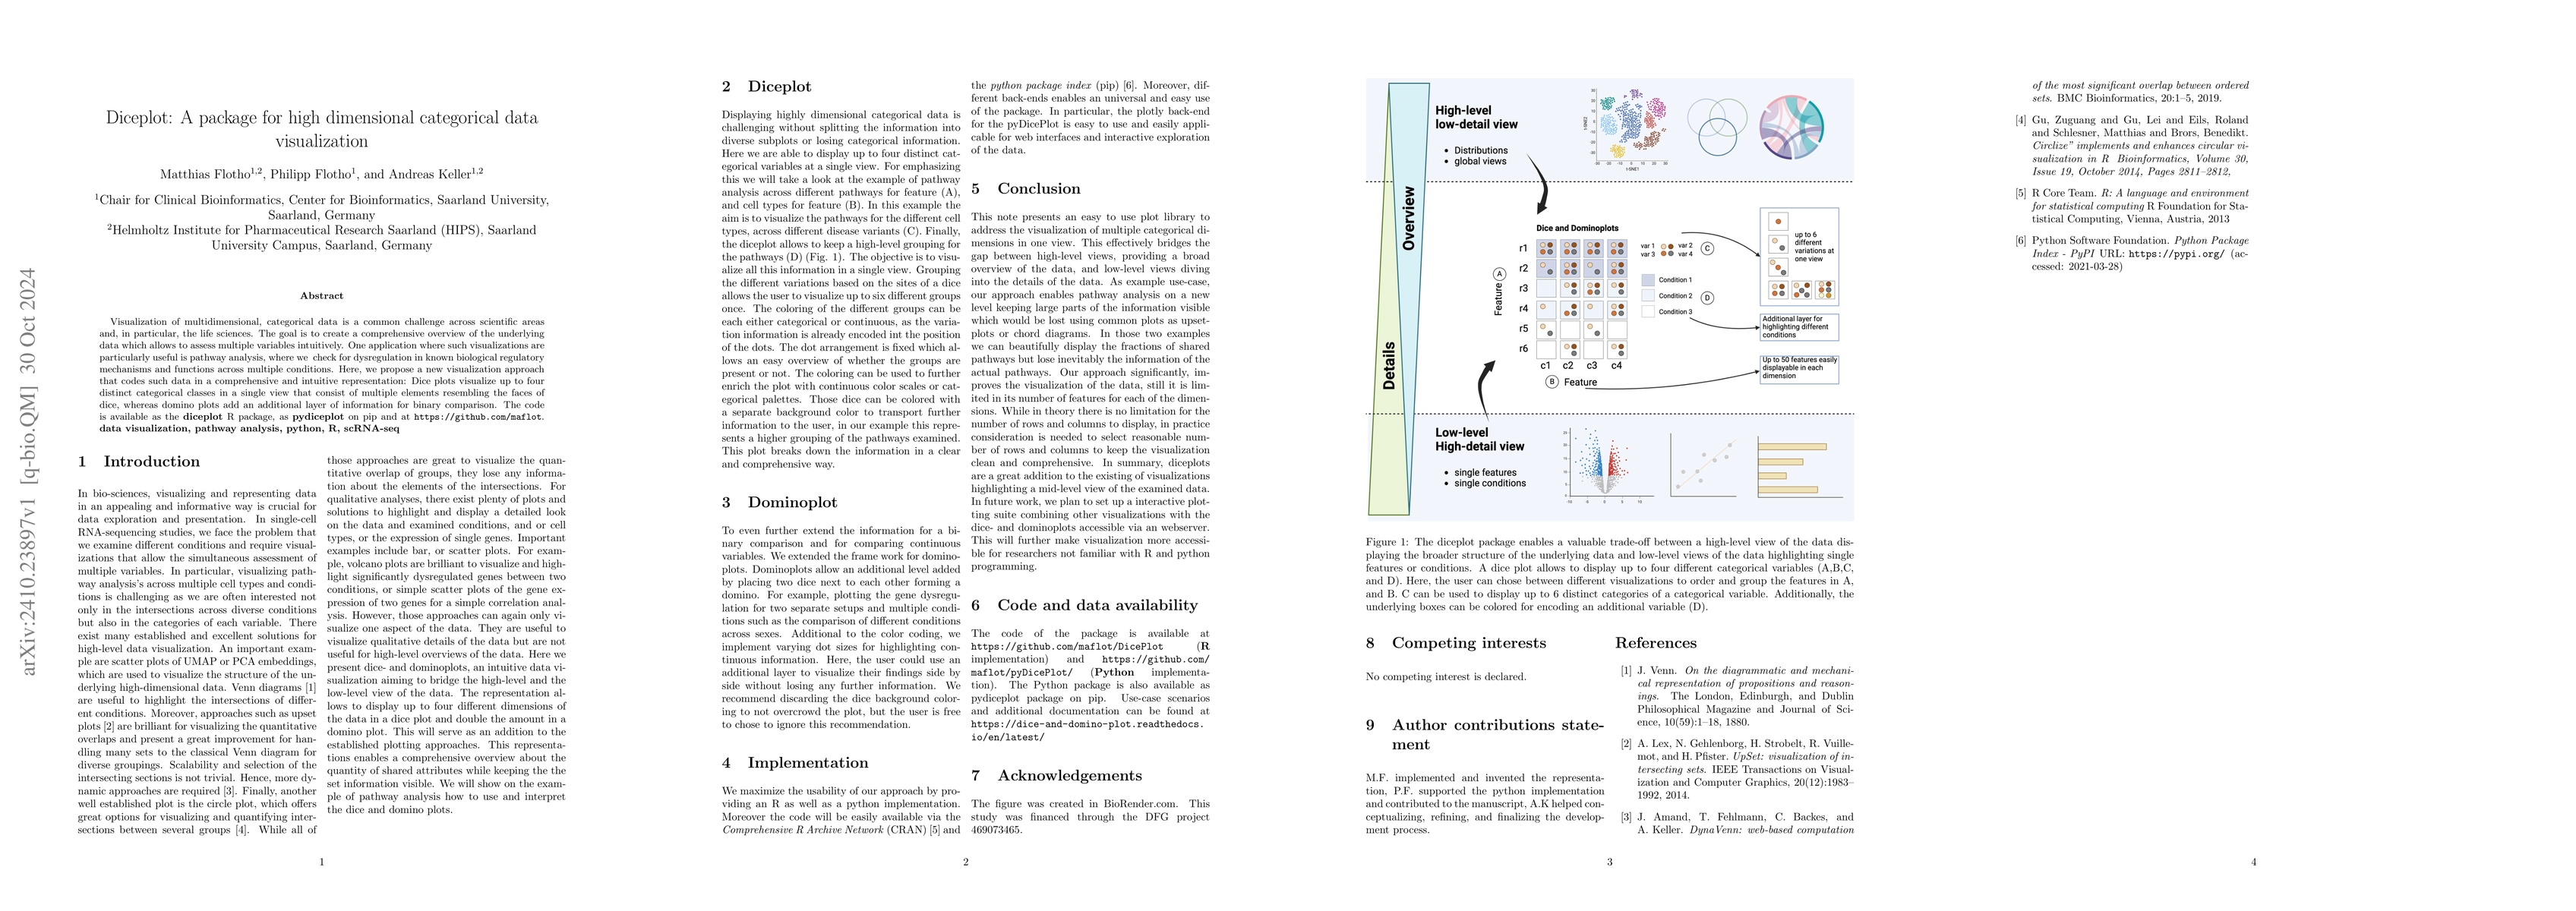
Visualization of multidimensional, categorical data is a common challenge across scientific areas and, in particular, the life sciences. The goal is to create a comprehensive overview of the underlying data which allows to assess multiple variables intuitively. One application where such visualizations are particularly useful is pathway analysis, where we check for dysregulation in known biological regulatory mechanisms and functions across multiple conditions. Here, we propose a new visualization approach that codes such data in a comprehensive and intuitive representation: Dice plots visualize up to four distinct categorical classes in a single view that consist of multiple elements resembling the faces of dice, whereas domino plots add an additional layer of information for binary comparison. The code is available as the diceplot R package, as pydiceplot on pip and at https://github.com/maflot.
AI Key Findings
Get AI-generated insights about this paper's methodology, results, significance, and more — seven facets brought into focus.
Impact
Paper Details
Authors
PDF Preview
Citation Network
Current paper (gray), citations (green), references (blue)
Display is limited for performance on very large graphs.
Discussion 0