Summary
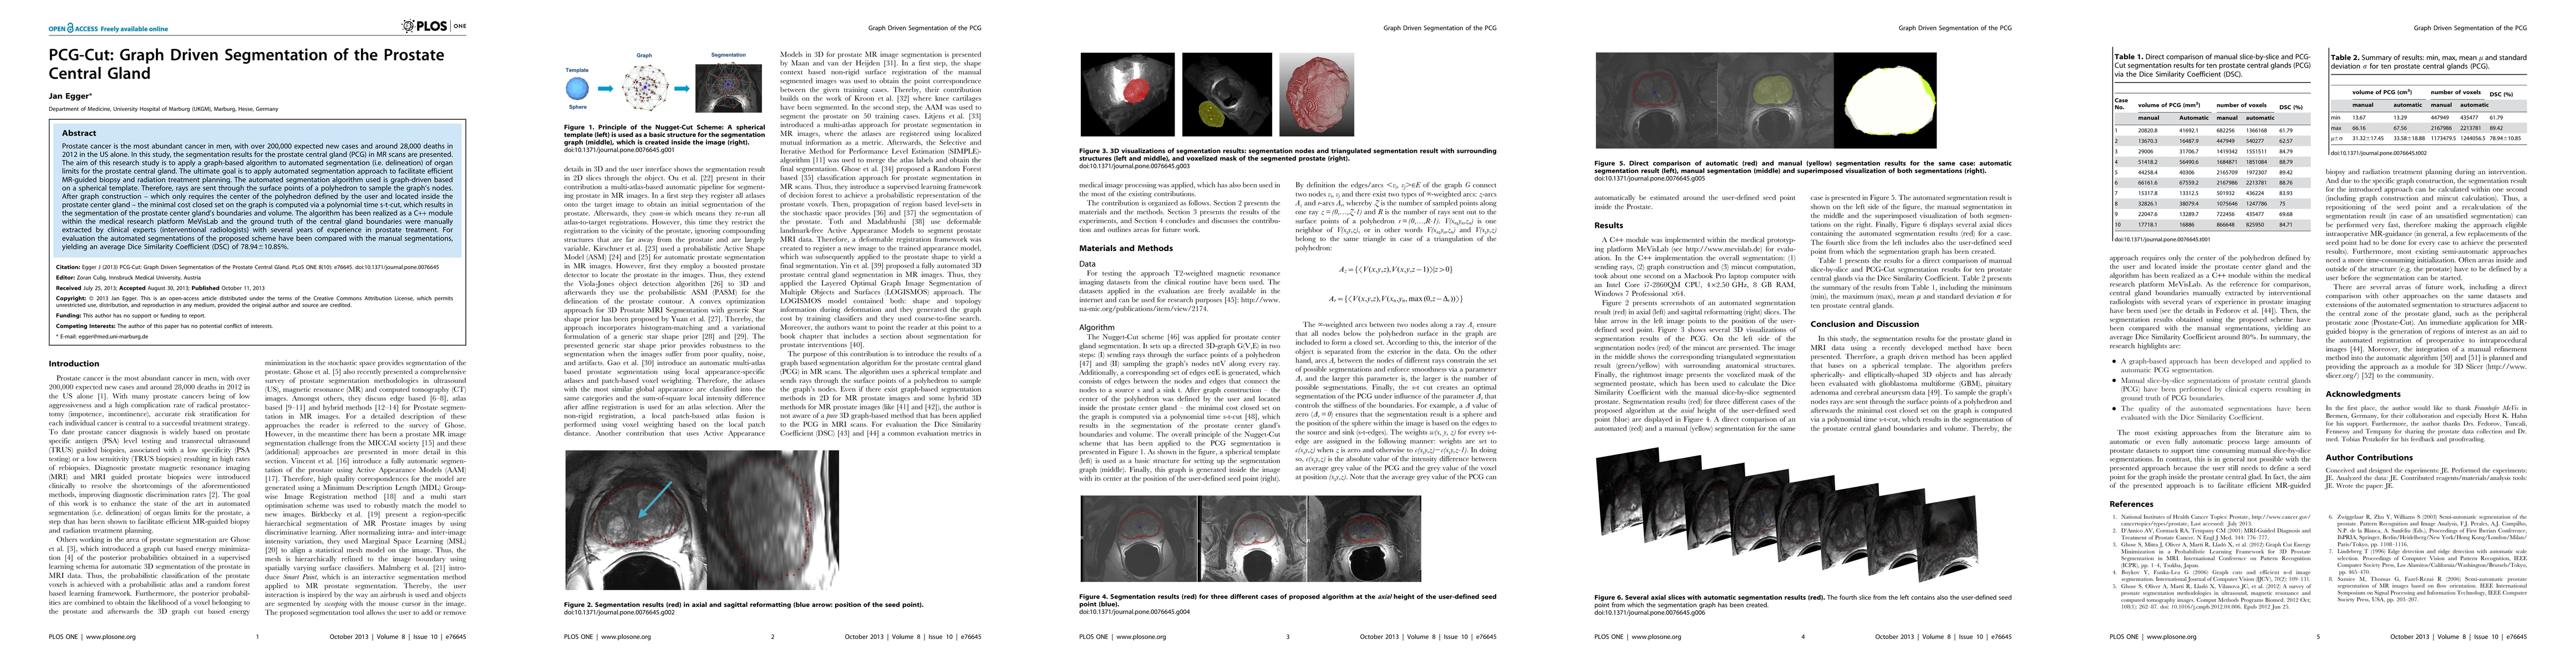
Prostate cancer is the most abundant cancer in men, with over 200,000 expected new cases and around 28,000 deaths in 2012 in the US alone. In this study, the segmentation results for the prostate central gland (PCG) in MR scans are presented. The aim of this research study is to apply a graph-based algorithm to automated segmentation (i.e. delineation) of organ limits for the prostate central gland. The ultimate goal is to apply automated segmentation approach to facilitate efficient MR-guided biopsy and radiation treatment planning. The automated segmentation algorithm used is graph-driven based on a spherical template. Therefore, rays are sent through the surface points of a polyhedron to sample the graph's nodes. After graph construction - which only requires the center of the polyhedron defined by the user and located inside the prostate center gland - the minimal cost closed set on the graph is computed via a polynomial time s-t-cut, which results in the segmentation of the prostate center gland's boundaries and volume. The algorithm has been realized as a C++ modul within the medical research platform MeVisLab and the ground truth of the central gland boundaries were manually extracted by clinical experts (interventional radiologists) with several years of experience in prostate treatment. For evaluation the automated segmentations of the proposed scheme have been compared with the manual segmentations, yielding an average Dice Similarity Coefficient (DSC) of 78.94 +/- 10.85%.
AI Key Findings
Get AI-generated insights about this paper's methodology, results, and significance.
Paper Details
PDF Preview
Key Terms
Citation Network
Current paper (gray), citations (green), references (blue)
Display is limited for performance on very large graphs.
Similar Papers
Found 4 papersPSHop: A Lightweight Feed-Forward Method for 3D Prostate Gland Segmentation
Jintang Xue, C. -C. Jay Kuo, Jiaxin Yang et al.
| Title | Authors | Year | Actions |
|---|
Comments (0)