PSHop: A Lightweight Feed-Forward Method for 3D Prostate Gland Segmentation
Publication
Metrics
AI Quick Summary
PSHop presents a lightweight, feed-forward method for 3D prostate gland segmentation using MRI, achieving effective segmentation with a Dice Similarity Coefficient of 0.873 while significantly reducing model size and complexity compared to traditional deep learning methods.
Paper Preview
Abstract
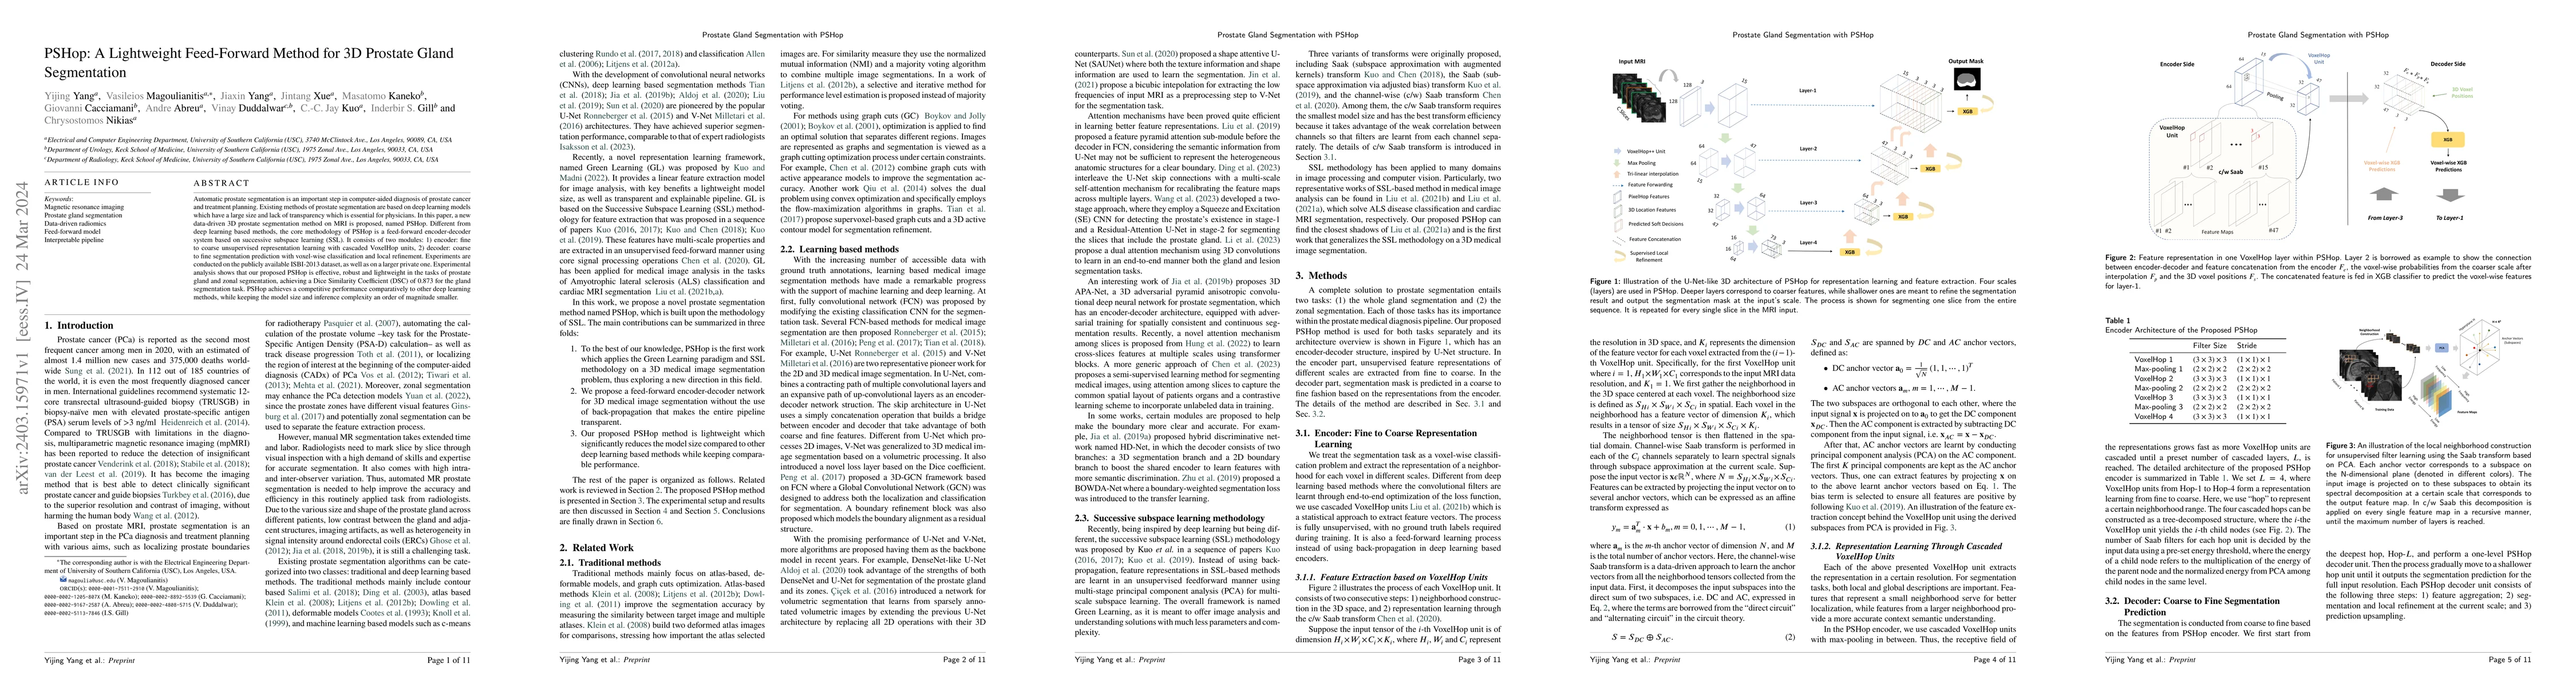
Automatic prostate segmentation is an important step in computer-aided diagnosis of prostate cancer and treatment planning. Existing methods of prostate segmentation are based on deep learning models which have a large size and lack of transparency which is essential for physicians. In this paper, a new data-driven 3D prostate segmentation method on MRI is proposed, named PSHop. Different from deep learning based methods, the core methodology of PSHop is a feed-forward encoder-decoder system based on successive subspace learning (SSL). It consists of two modules: 1) encoder: fine to coarse unsupervised representation learning with cascaded VoxelHop units, 2) decoder: coarse to fine segmentation prediction with voxel-wise classification and local refinement. Experiments are conducted on the publicly available ISBI-2013 dataset, as well as on a larger private one. Experimental analysis shows that our proposed PSHop is effective, robust and lightweight in the tasks of prostate gland and zonal segmentation, achieving a Dice Similarity Coefficient (DSC) of 0.873 for the gland segmentation task. PSHop achieves a competitive performance comparatively to other deep learning methods, while keeping the model size and inference complexity an order of magnitude smaller.
AI Key Findings
Get AI-generated insights about this paper's methodology, results, significance, and more — seven facets brought into focus.
Impact
Paper Details
Authors
PDF Preview
Key Terms
Citation Network
Current paper (gray), citations (green), references (blue)
Display is limited for performance on very large graphs.
Discussion 0