Publication
Metrics
AI Quick Summary
The study uses Quantum Monte Carlo simulations to explore the phase diagram of hard core bosons on a lattice with anisotropic interactions, revealing a superfluid phase and two crystalline phases at half filling, but no supersolid phase.
Paper Preview
Abstract
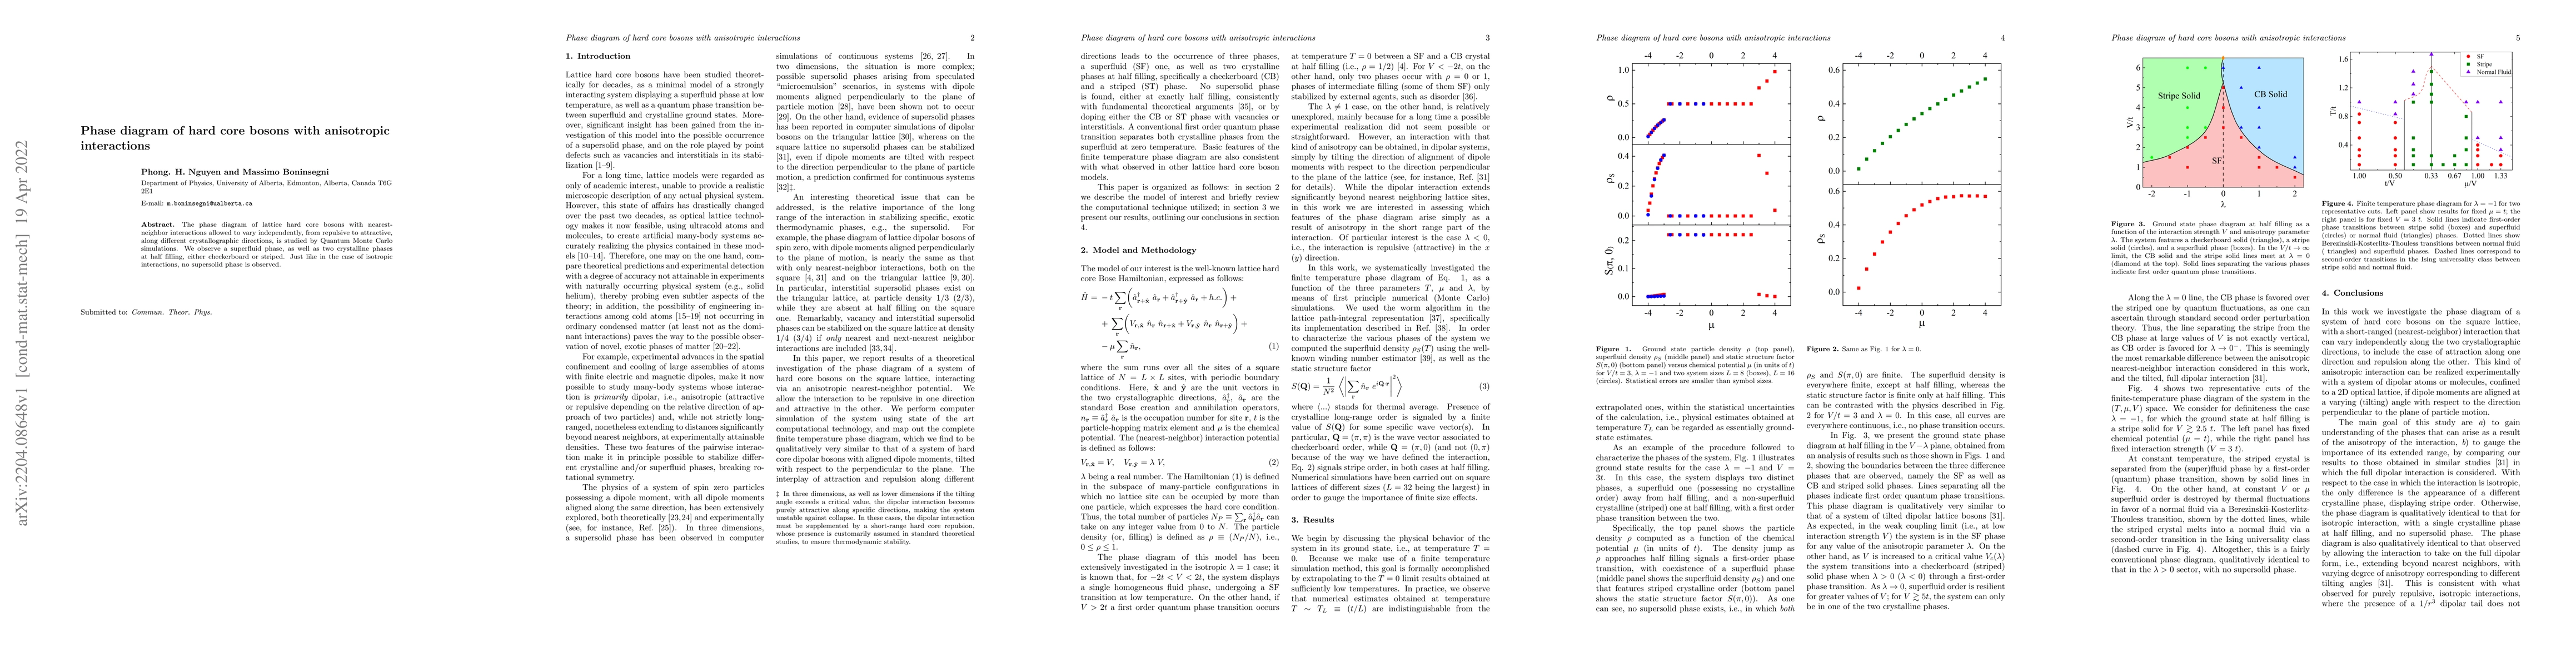
The phase diagram of lattice hard core bosons with nearest-neighbor interactions allowed to vary independently, from repulsive to attractive, along different crystallographic directions, is studied by Quantum Monte Carlo simulations. We observe a superfluid phase, as well as two crystalline phases at half filling, either checkerboard or striped. Just like in the case of isotropic interactions, no supersolid phase is observed.
AI Key Findings
Get AI-generated insights about this paper's methodology, results, significance, and more — seven facets brought into focus.
Impact
Paper Details
Authors
PDF Preview
Key Terms
Citation Network
Current paper (gray), citations (green), references (blue)
Display is limited for performance on very large graphs.
Discussion 0