Authors
Summary
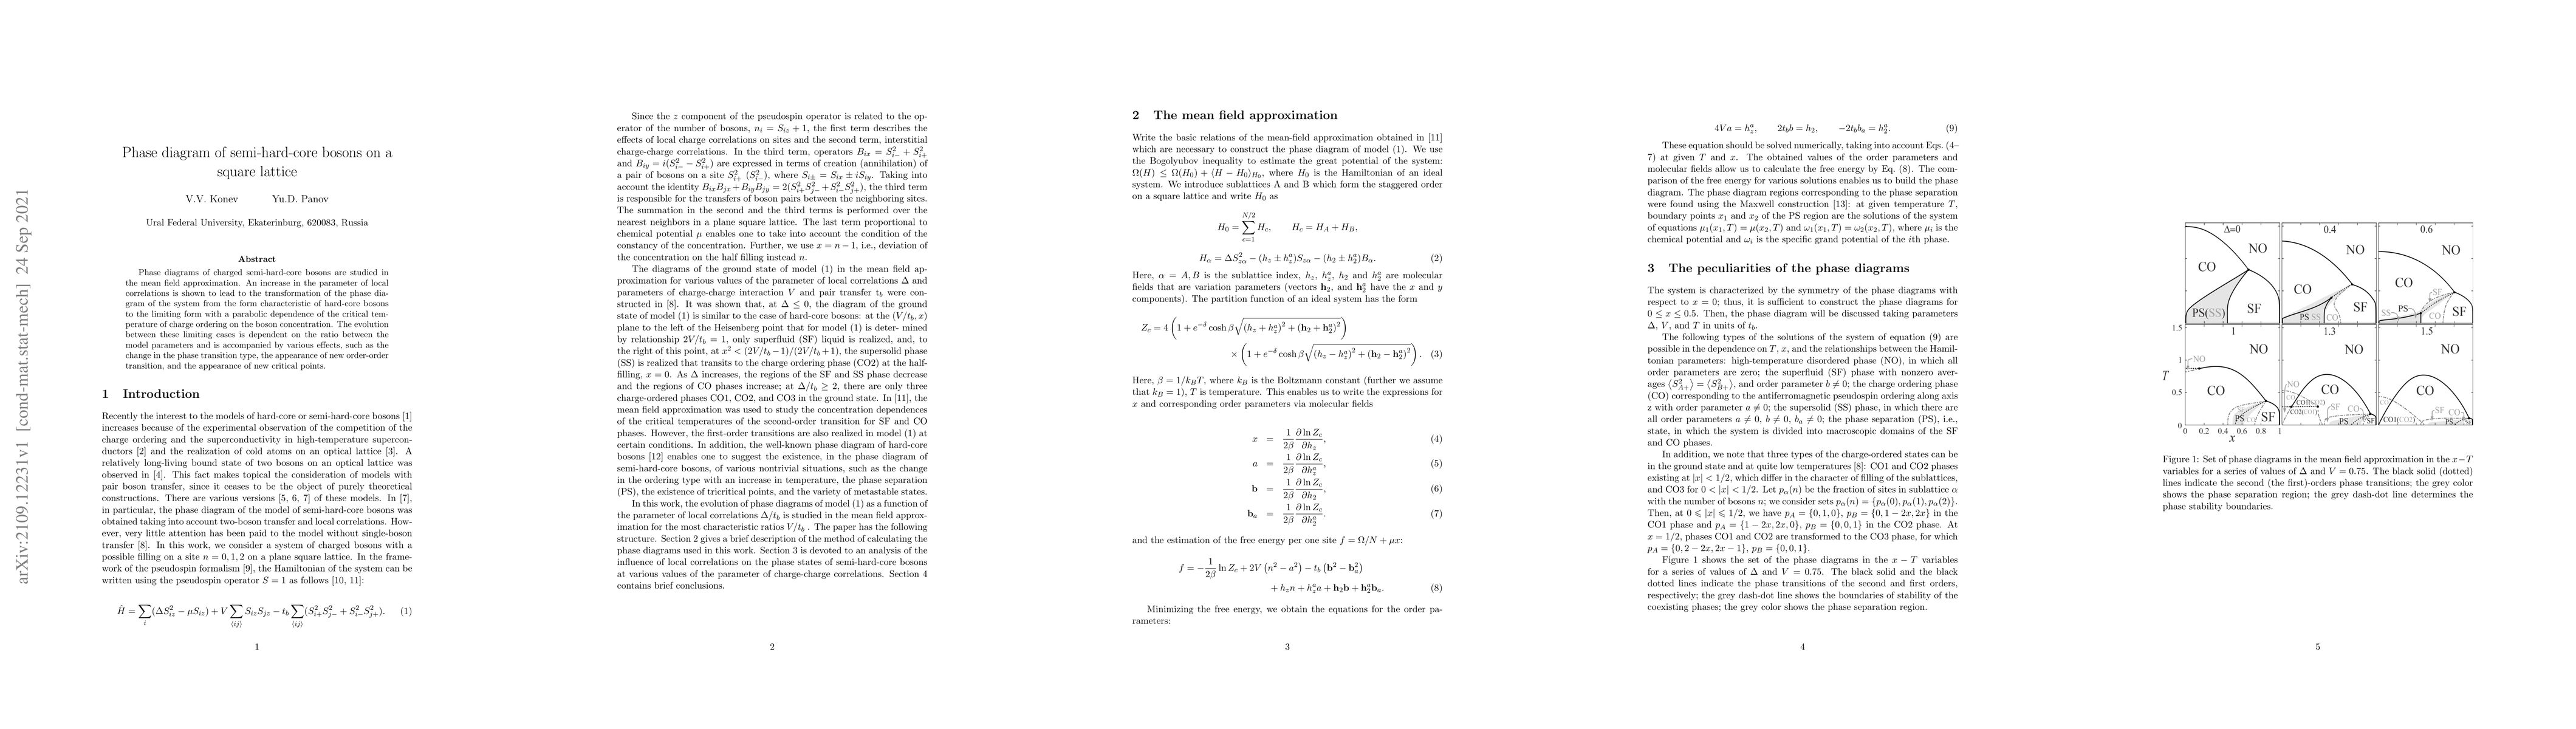
Phase diagrams of charged semi-hard-core bosons are studied in the mean field approximation. An increase in the parameter of local correlations is shown to lead to the transformation of the phase diagram of the system from the form characteristic of hard-core bosons to the limiting form with a parabolic dependence of the critical temperature of charge ordering on the boson concentration. The evolution between these limiting cases is dependent on the ratio between the model parameters and is accompanied by various effects, such as the change in the phase transition type, the appearance of new order-order transition, and the appearance of new critical points.
AI Key Findings
Get AI-generated insights about this paper's methodology, results, and significance.
Paper Details
PDF Preview
Key Terms
Citation Network
Current paper (gray), citations (green), references (blue)
Display is limited for performance on very large graphs.
Similar Papers
Found 4 papersThe influence of local correlations on the phase states in the model of semi-hard-core bosons on a square lattice
V. A. Ulitko, V. V. Konev, A. A. Chikov et al.
Phase diagram of hard core bosons with anisotropic interactions
Massimo Boninsegni, Phong H. Nguyen
| Title | Authors | Year | Actions |
|---|
Comments (0)