Publication
Metrics
AI Quick Summary
This paper proposes an interpolation algorithm to enhance the quality of LiDAR point clouds compressed via lossy methods, aiming to improve edge-assisted LiDAR perception performance. The algorithm interpolates points in the range image representation based on depth gradients, demonstrating better qualitative results compared to existing image interpolation methods.
Paper Preview
Abstract
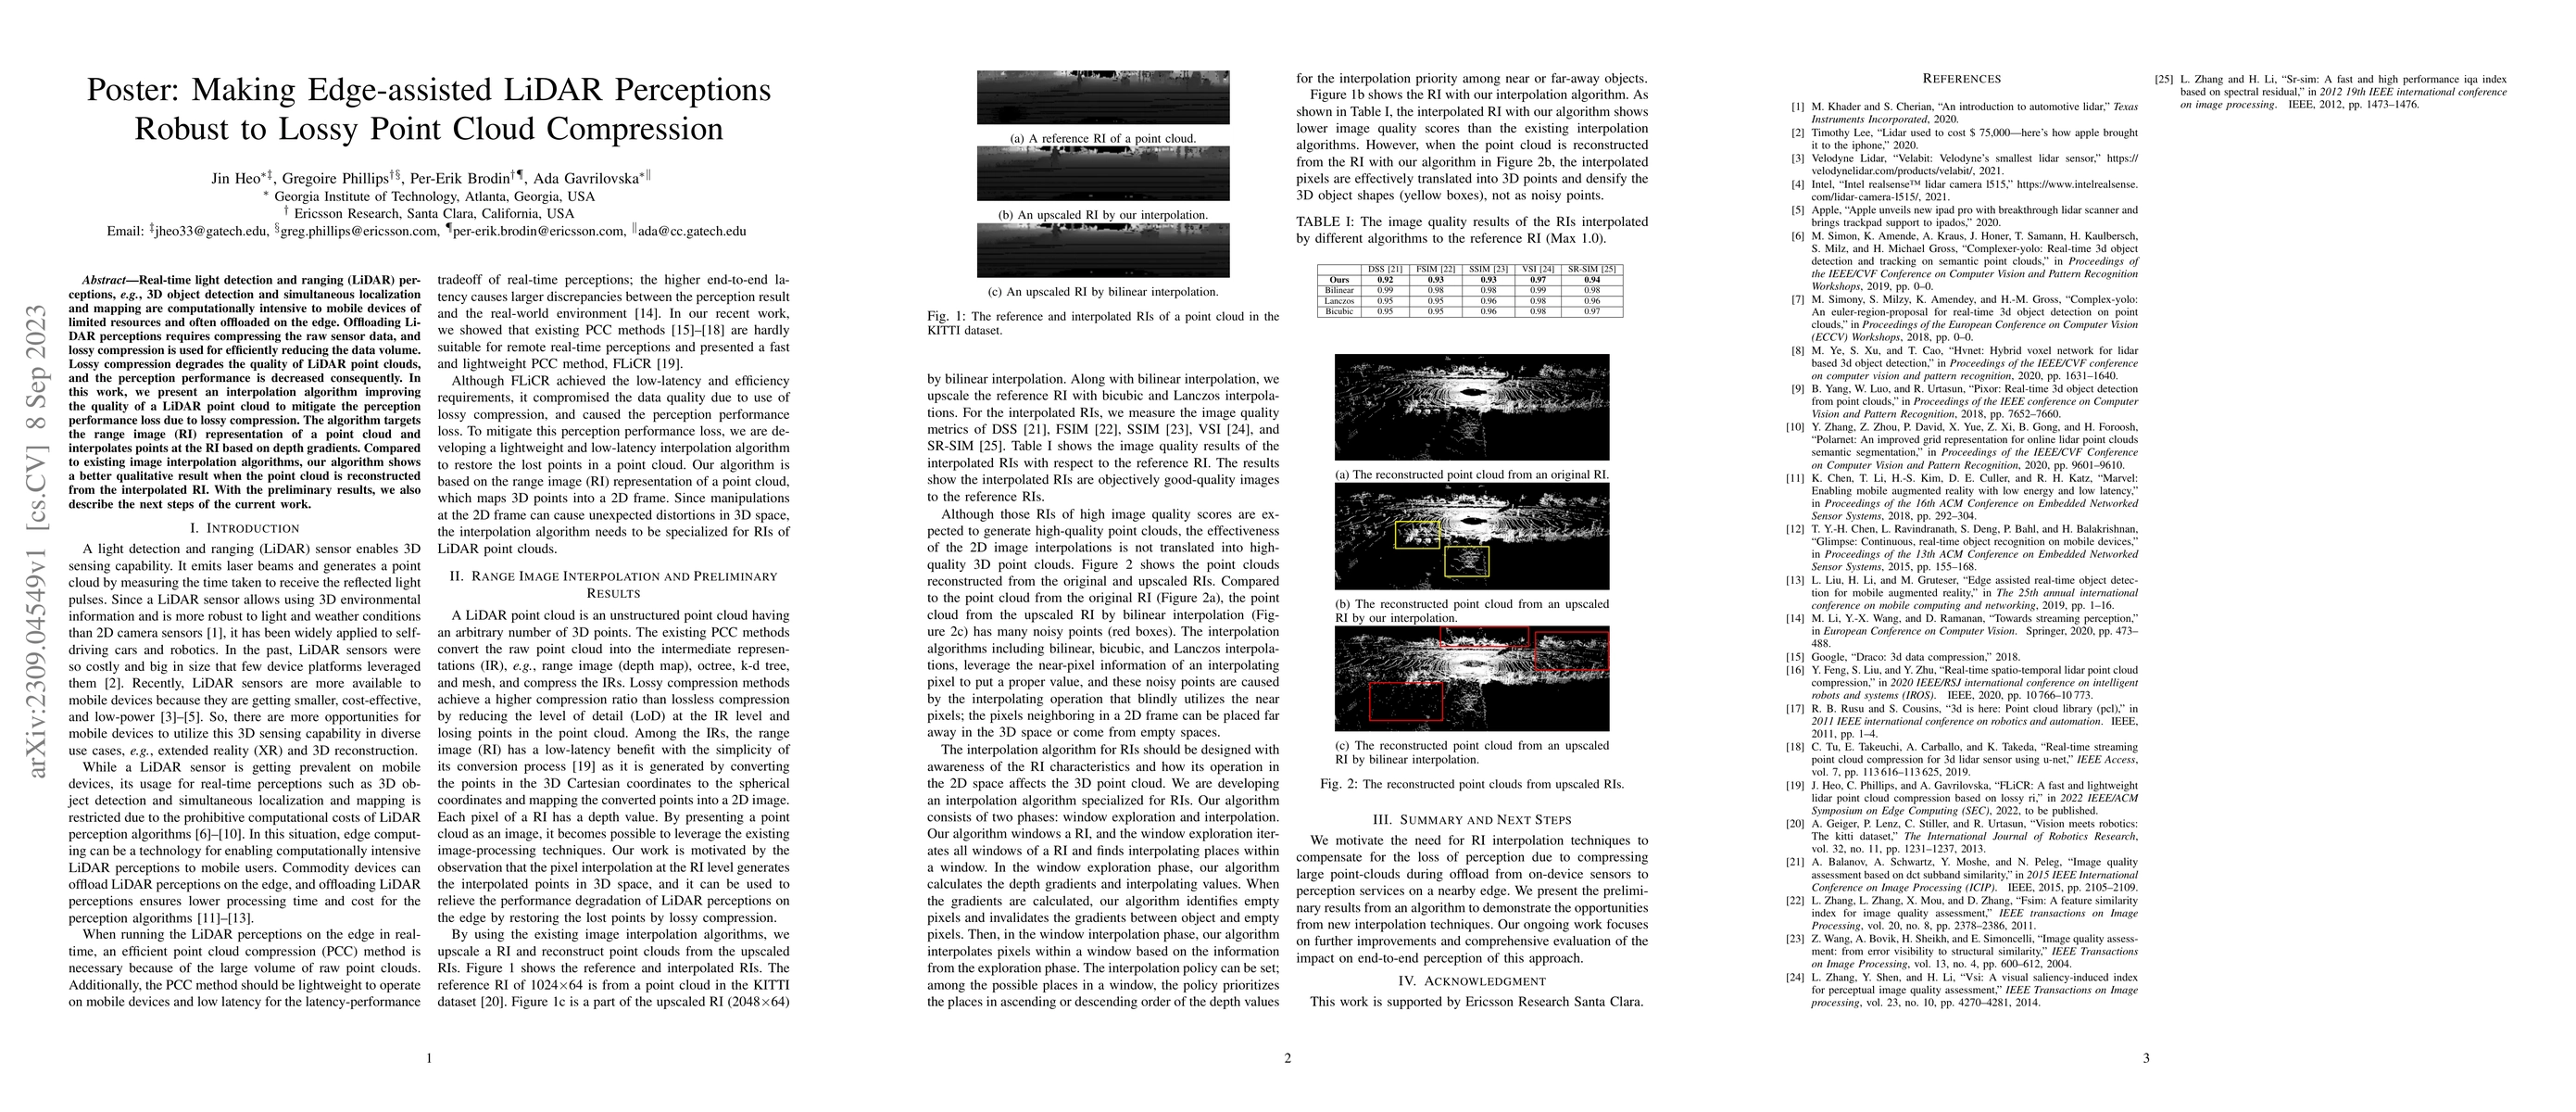
Real-time light detection and ranging (LiDAR) perceptions, e.g., 3D object detection and simultaneous localization and mapping are computationally intensive to mobile devices of limited resources and often offloaded on the edge. Offloading LiDAR perceptions requires compressing the raw sensor data, and lossy compression is used for efficiently reducing the data volume. Lossy compression degrades the quality of LiDAR point clouds, and the perception performance is decreased consequently. In this work, we present an interpolation algorithm improving the quality of a LiDAR point cloud to mitigate the perception performance loss due to lossy compression. The algorithm targets the range image (RI) representation of a point cloud and interpolates points at the RI based on depth gradients. Compared to existing image interpolation algorithms, our algorithm shows a better qualitative result when the point cloud is reconstructed from the interpolated RI. With the preliminary results, we also describe the next steps of the current work.
AI Key Findings
Get AI-generated insights about this paper's methodology, results, significance, and more — seven facets brought into focus.
Impact
Paper Details
Authors
PDF Preview
Key Terms
Citation Network
Current paper (gray), citations (green), references (blue)
Display is limited for performance on very large graphs.
Discussion 0