Summary
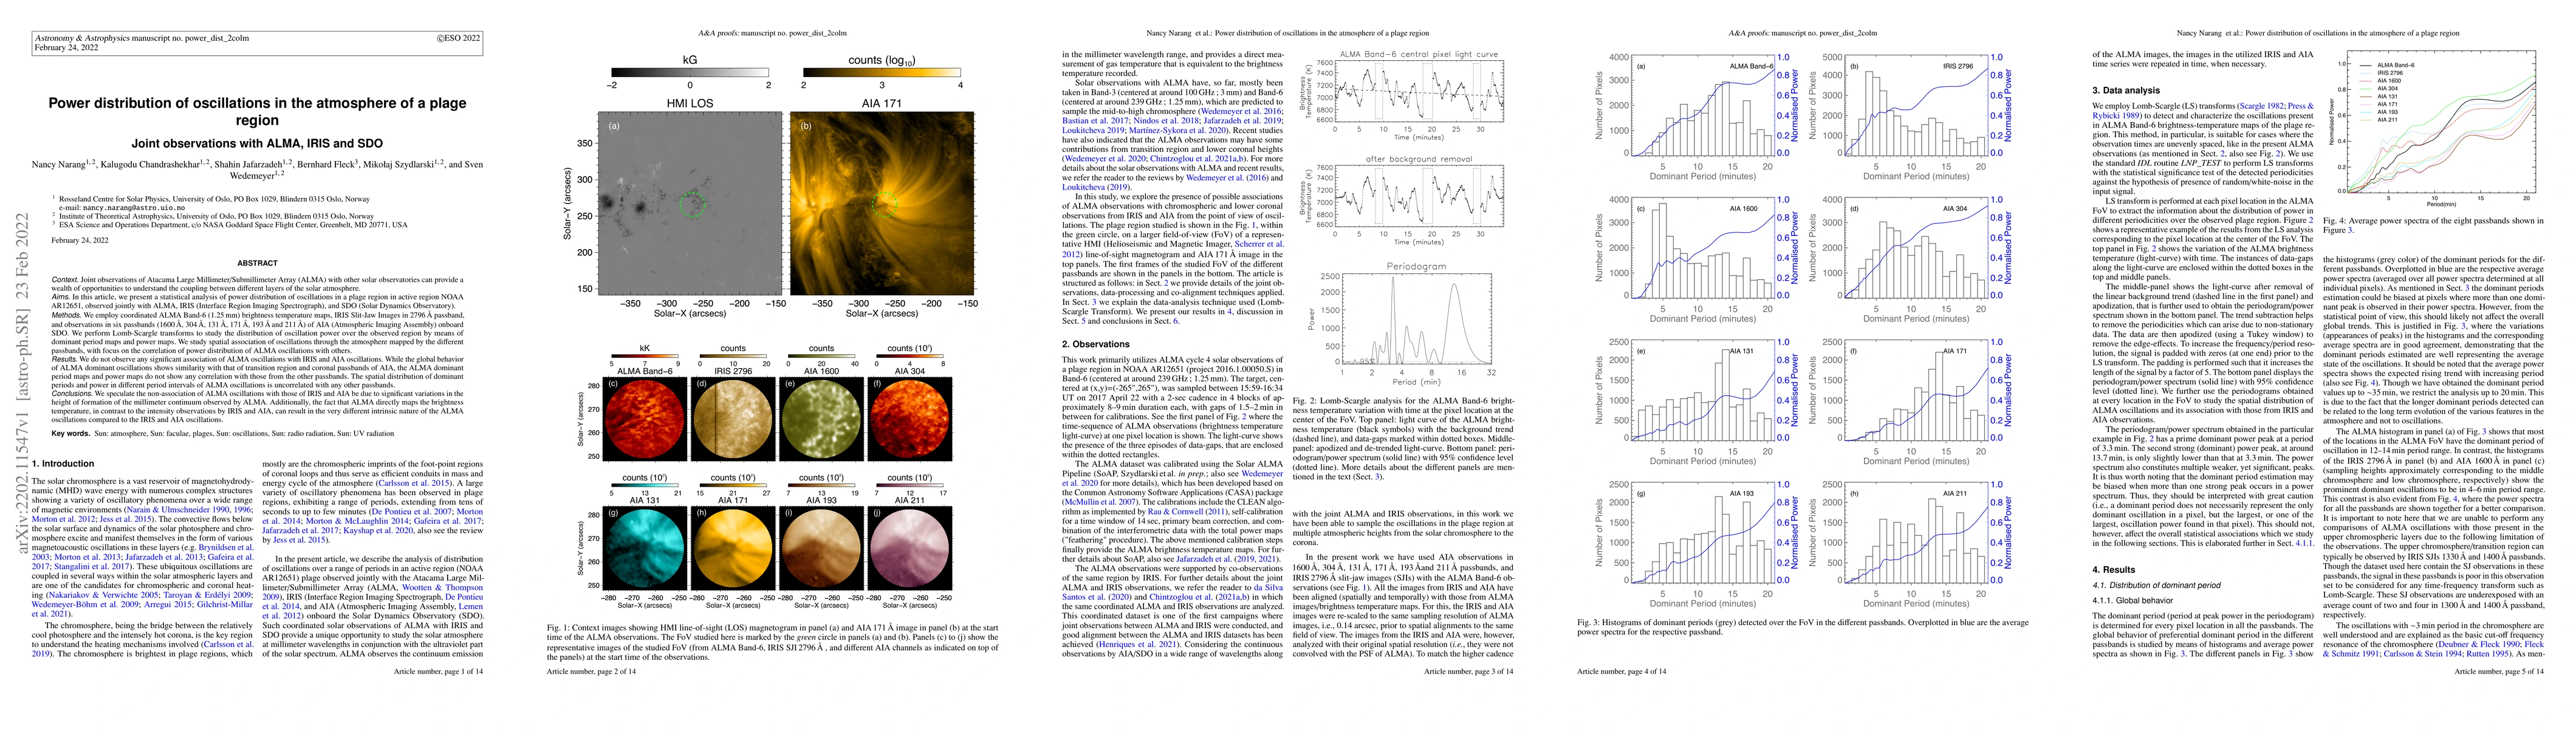
We present a statistical analysis of power distribution of oscillations in a plage region in active region NOAA AR12651, observed jointly with ALMA (Atacama Large Millimeter/Submillimeter Array), IRIS (Interface Region Imaging Spectrograph), and SDO (Solar Dynamics Observatory). We employ coordinated ALMA Band-6 (1.25 mm) brightness temperature maps, IRIS Slit-Jaw Images in 2796 {\AA} passband, and observations in six passbands (1600 {\AA}, 304 {\AA}, 131 {\AA}, 171 {\AA}, 193 {\AA} and 211 {\AA}) of AIA (Atmospheric Imaging Assembly) onboard SDO. We perform Lomb-Scargle transforms to study the distribution of oscillation power over the observed region by means of dominant period maps and power maps. We study spatial association of oscillations through the atmosphere mapped by the different passbands, with focus on the correlation of power distribution of ALMA oscillations with others. We do not observe any significant association of ALMA oscillations with IRIS and AIA oscillations. While the global behavior of ALMA dominant oscillations shows similarity with that of transition region and coronal passbands of AIA, the ALMA dominant period maps and power maps do not show any correlation with those from the other passbands. The spatial distribution of dominant periods and power in different period intervals of ALMA oscillations is uncorrelated with any other passband. We speculate the non-association of ALMA oscillations with those of IRIS and AIA be due to significant variations in the height of formation of the millimeter continuum observed by ALMA. Additionally, the fact that ALMA directly maps the brightness temperature, in contrast to the intensity observations by IRIS and AIA, can result in the very different intrinsic nature of the ALMA oscillations compared to the IRIS and AIA oscillations.
AI Key Findings
Get AI-generated insights about this paper's methodology, results, and significance.
Paper Details
PDF Preview
Key Terms
Citation Network
Current paper (gray), citations (green), references (blue)
Display is limited for performance on very large graphs.
Similar Papers
Found 4 papers| Title | Authors | Year | Actions |
|---|
Comments (0)