Authors
Summary
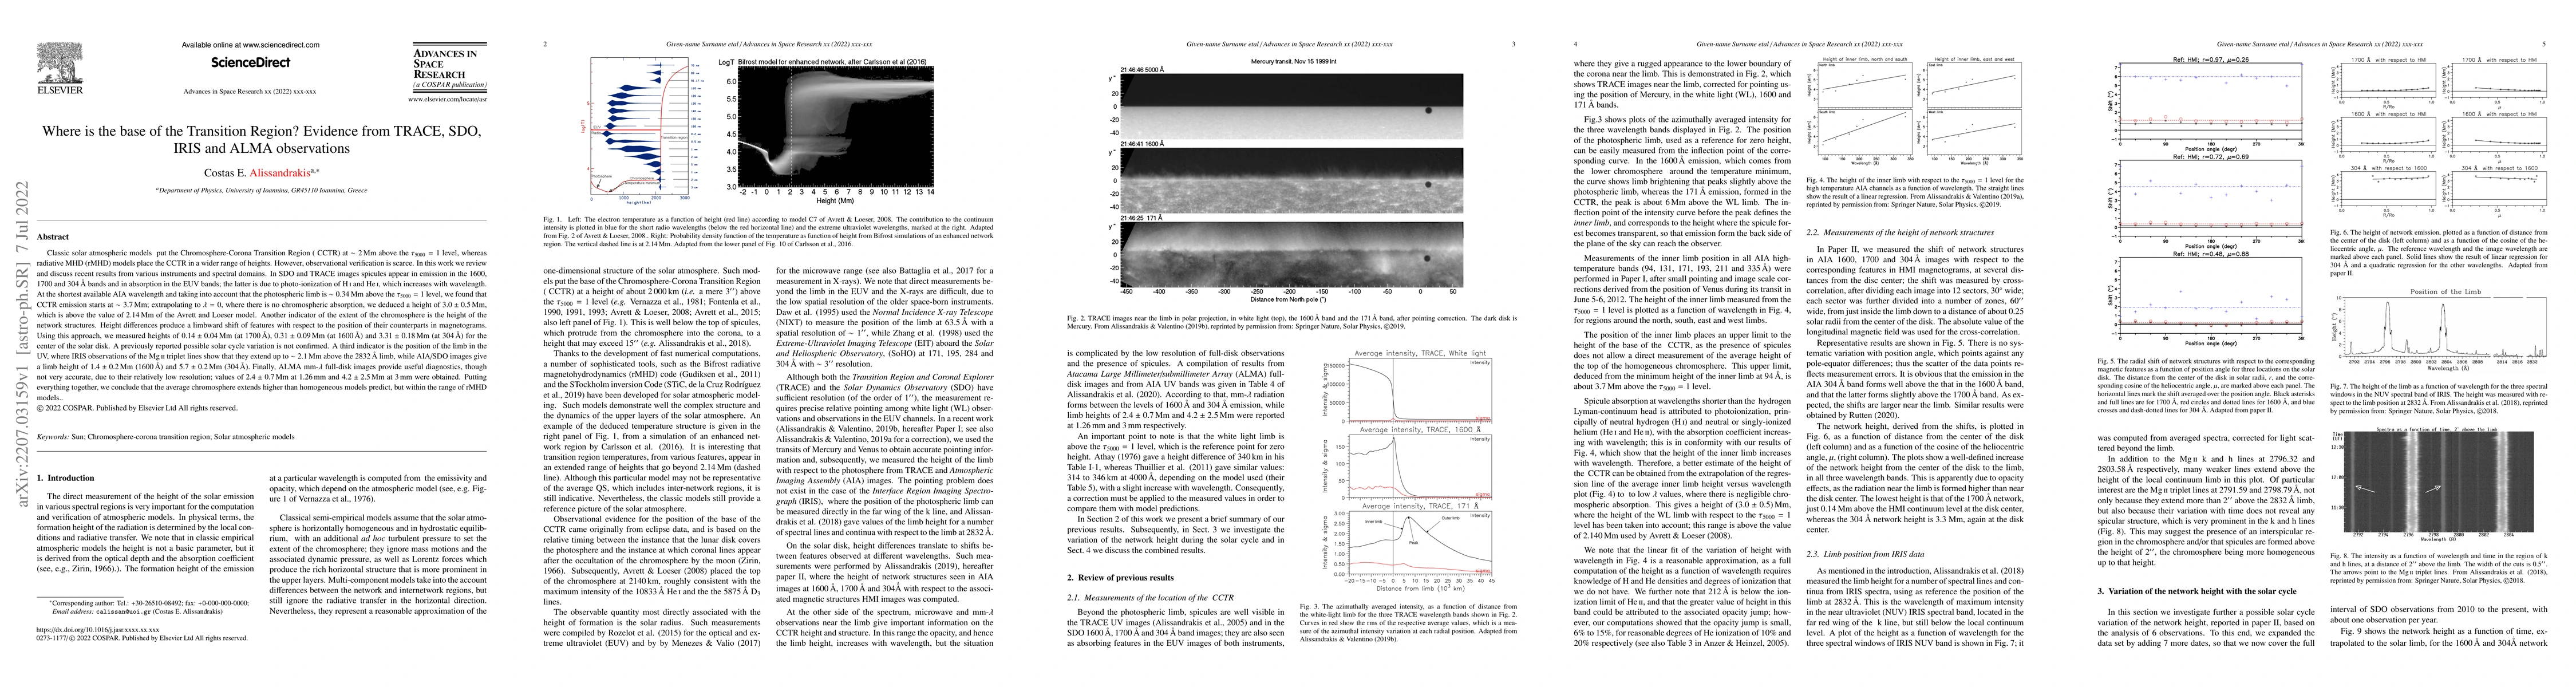
Classic solar models put the Chromosphere-Corona Transition Region (CCTR} at $\sim2$Mm above the $\tau_{5000} = 1$ level, whereas rMHD models place it in a wider range of heights. Observational verification is scarce. We review and discuss recent results from various instruments and spectral domains. In SDO and TRACE images spicules appear in emission in the 1600, 1700 and 304 A bands and in absorption in the EUV bands; the latter is due to photo-ionization of H and He I. At the shortest available AIA wavelength and taking into account that the photospheric limb is $\sim0.34$Mm above the $\tau_{5000}=1$ level, we found that CCTR emission starts at $\sim3.7$Mm; extrapolating to $\lambda=0$, where there is no chromospheric absorption, we deduced a height of $3.0\pm 0.5$Mm, above the value of 2.14Mm of the Avrett & Loeser model. Another indicator of the extent of the chromosphere is the height of the network structures. Height differences produce a limbward shift of features with respect to their counterparts in magnetograms. Using this approach, we measured heights of $0.14\pm0.04$Mm (at 1700 A), $0.31\pm0.09$Mm (at 1600 A) and $3.31\pm 0.18$Mm (at 304 A) for the center of the solar disk. A previously reported possible solar cycle variation is not confirmed. A third indicator is the position of the limb in the UV, where IRIS observations of the Mg II triplet lines show that they extend up to $\sim2.1$Mm above the 2832 A limb, while AIA/SDO images give a limb height of $1.4 \pm 0.2$Mm (1600 A) and $5.7\pm 0.2$Mm (304 A). Finally, ALMA mm-$\lambda$ full-disk images provide useful diagnostics, though not very accurate; values of $2.4\pm0.7$Mm at 1.26mm and $4.2\pm2.5$Mm at 3mm were obtained. Putting everything together, we conclude that the average chromosphere extends higher than homogeneous models predict, but within the range of rMHD models.
AI Key Findings
Get AI-generated insights about this paper's methodology, results, and significance.
Paper Details
PDF Preview
Key Terms
Citation Network
Current paper (gray), citations (green), references (blue)
Display is limited for performance on very large graphs.
Similar Papers
Found 4 papersPower distribution of oscillations in the atmosphere of a plage region: Joint observations with ALMA, IRIS and SDO
Sven Wedemeyer, Shahin Jafarzadeh, Mikołaj Szydlarski et al.
Comparative Image Alignment for Multiple Telescopes: ALMA, IRIS, SDO
Francisco J. Ordoñez Araujo, Juan Camilo Guevara Gómez, Benjamín Calvo Mozo
| Title | Authors | Year | Actions |
|---|
Comments (0)