Authors
Summary
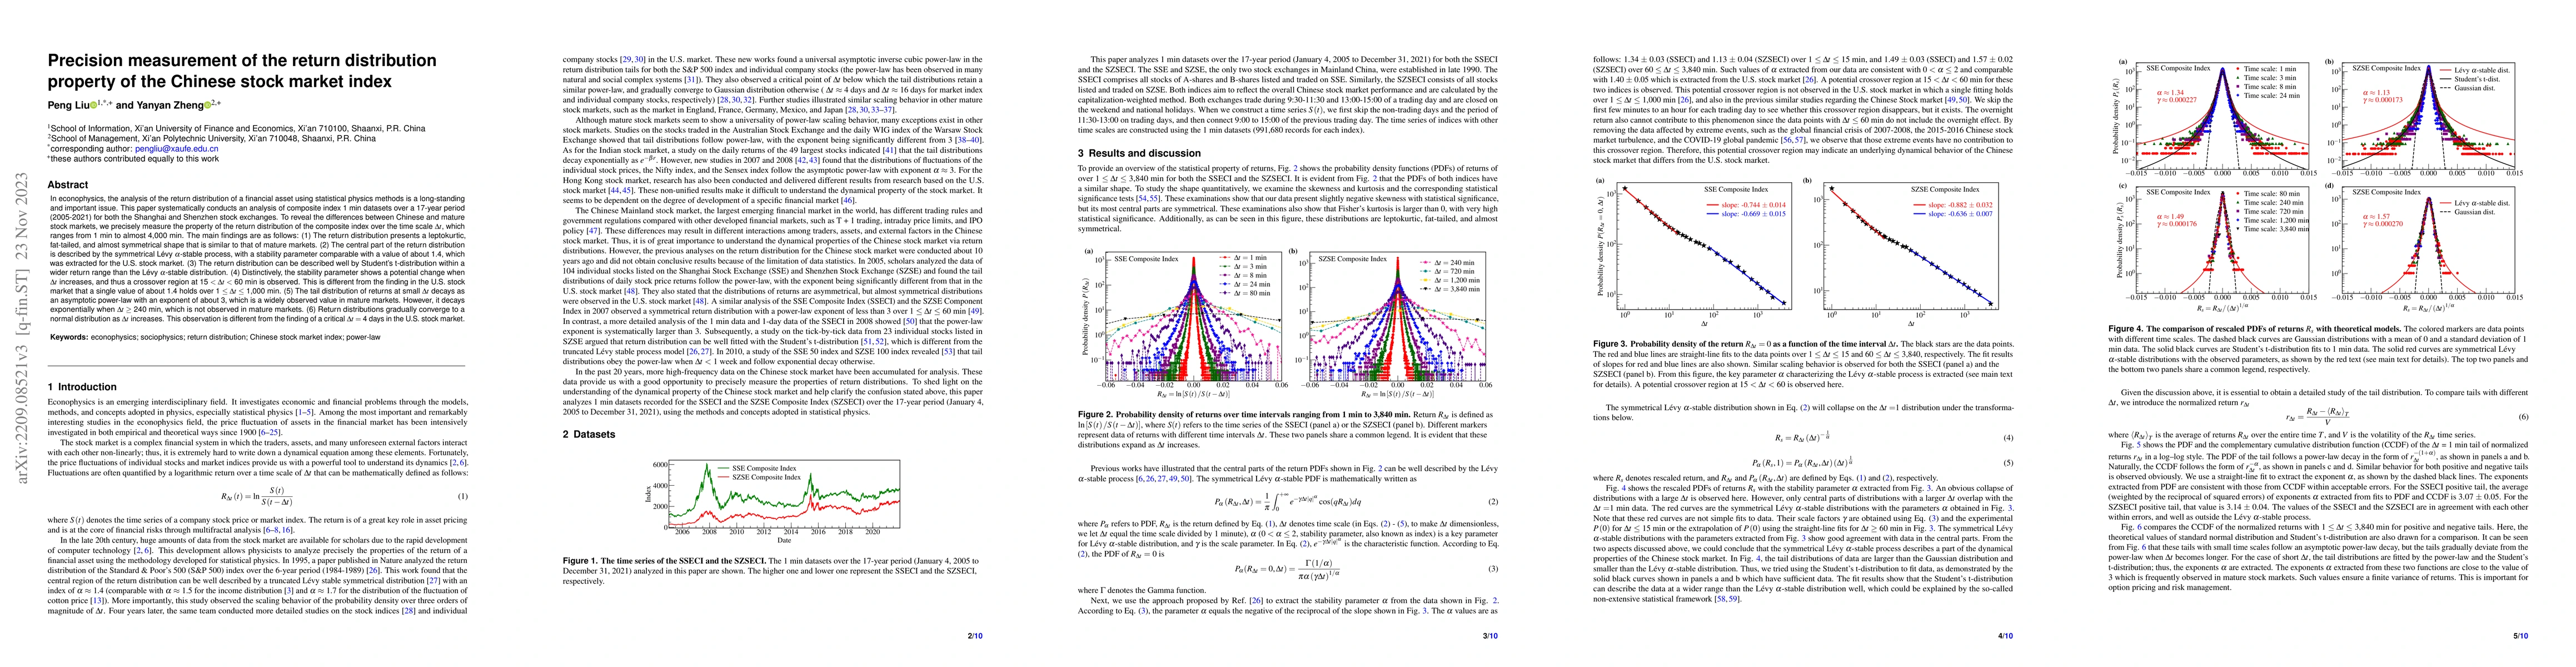
This paper systematically conducts an analysis of the composite index 1-min datasets over the 17-year period (2005-2021) for both the Shanghai and Shenzhen stock exchanges. To reveal the difference between the Chinese and the mature stock markets, here we precisely measure the property of return distribution of composite index over the time scale $\Delta t$ ranging from 1 min up to almost 4,000 min. The main findings are as follows. (1) Return distribution presents a leptokurtic, fat-tailed, and almost symmetrical shape, which is similar to that of mature markets. (2) The central part of return distribution is well described by the symmetrical L\'{e}vy $\alpha$-stable process with a stability parameter comparable with the value of about 1.4 extracted in the U.S. stock market. (3) Return distribution can be well described by the student's t-distribution within a wider return range than the L\'{e}vy $\alpha$-stable distribution. (4) Distinctively, the stability parameter shows a potential change when $\Delta t$ increases, and thus a crossover region at 15 $< \Delta t <$ 60 min is observed. This is different from the finding in the U.S. stock market where a single value of about 1.4 holds over 1 $\le \Delta t \le$ 1,000 min. (5) The tail distribution of returns at small $\Delta t$ decays as an asymptotic power-law with an exponent of about 3, which is a value widely existing in mature markets. However, it decays exponentially when $\Delta t \ge$ 240 min, which is not observed in mature markets. (6) Return distributions gradually converge to Gaussian as $\Delta t$ increases. This observation is different from the finding of a critical $\Delta t =$ 4 days in the U.S. stock market.
AI Key Findings
Get AI-generated insights about this paper's methodology, results, and significance.
Paper Details
PDF Preview
Key Terms
Citation Network
Current paper (gray), citations (green), references (blue)
Display is limited for performance on very large graphs.
Similar Papers
Found 4 papers| Title | Authors | Year | Actions |
|---|
Comments (0)