Publication
Metrics
AI Quick Summary
This research presents a Prolog visualization system that employs Logichart diagrams to make Prolog execution flow comprehensible, aiding in Prolog programming education. The system visually traces Prolog execution, dynamically updates changes in the program, and displays variable substitutions in real time.
Paper Preview
Abstract
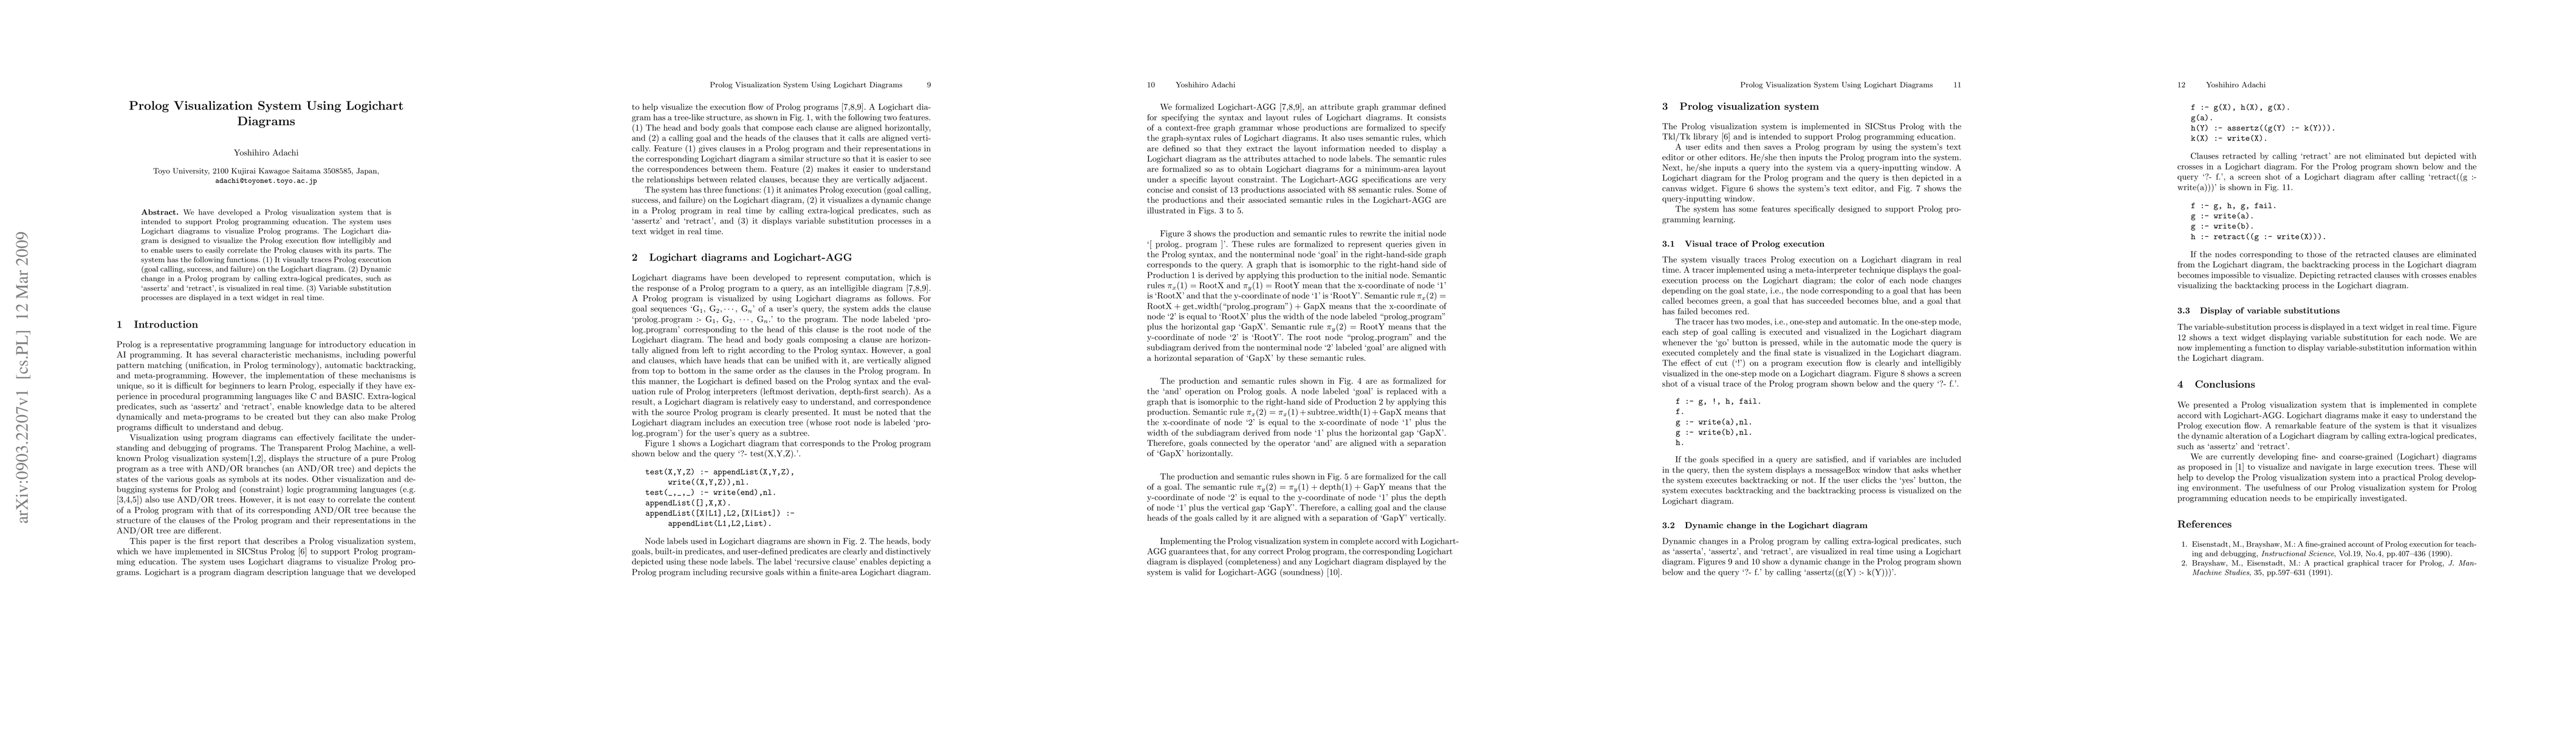
We have developed a Prolog visualization system that is intended to support Prolog programming education. The system uses Logichart diagrams to visualize Prolog programs. The Logichart diagram is designed to visualize the Prolog execution flow intelligibly and to enable users to easily correlate the Prolog clauses with its parts. The system has the following functions. (1) It visually traces Prolog execution (goal calling, success, and failure) on the Logichart diagram. (2) Dynamic change in a Prolog program by calling extra-logical predicates, such as `assertz' and `retract', is visualized in real time. (3) Variable substitution processes are displayed in a text widget in real time.
AI Key Findings
Get AI-generated insights about this paper's methodology, results, significance, and more — seven facets brought into focus.
Impact
Paper Details
PDF Preview
Key Terms
Citation Network
Current paper (gray), citations (green), references (blue)
Display is limited for performance on very large graphs.
Discussion 0