Publication
Metrics
AI Quick Summary
This study quantifies defects in graphene using Raman spectroscopy at various excitation energies, finding that the D to G peak intensity ratio depends on excitation energy and correlates with defect density. The analysis resolves ambiguity in defect density determination by examining the G peak width and its dispersion.
Paper Preview
Abstract
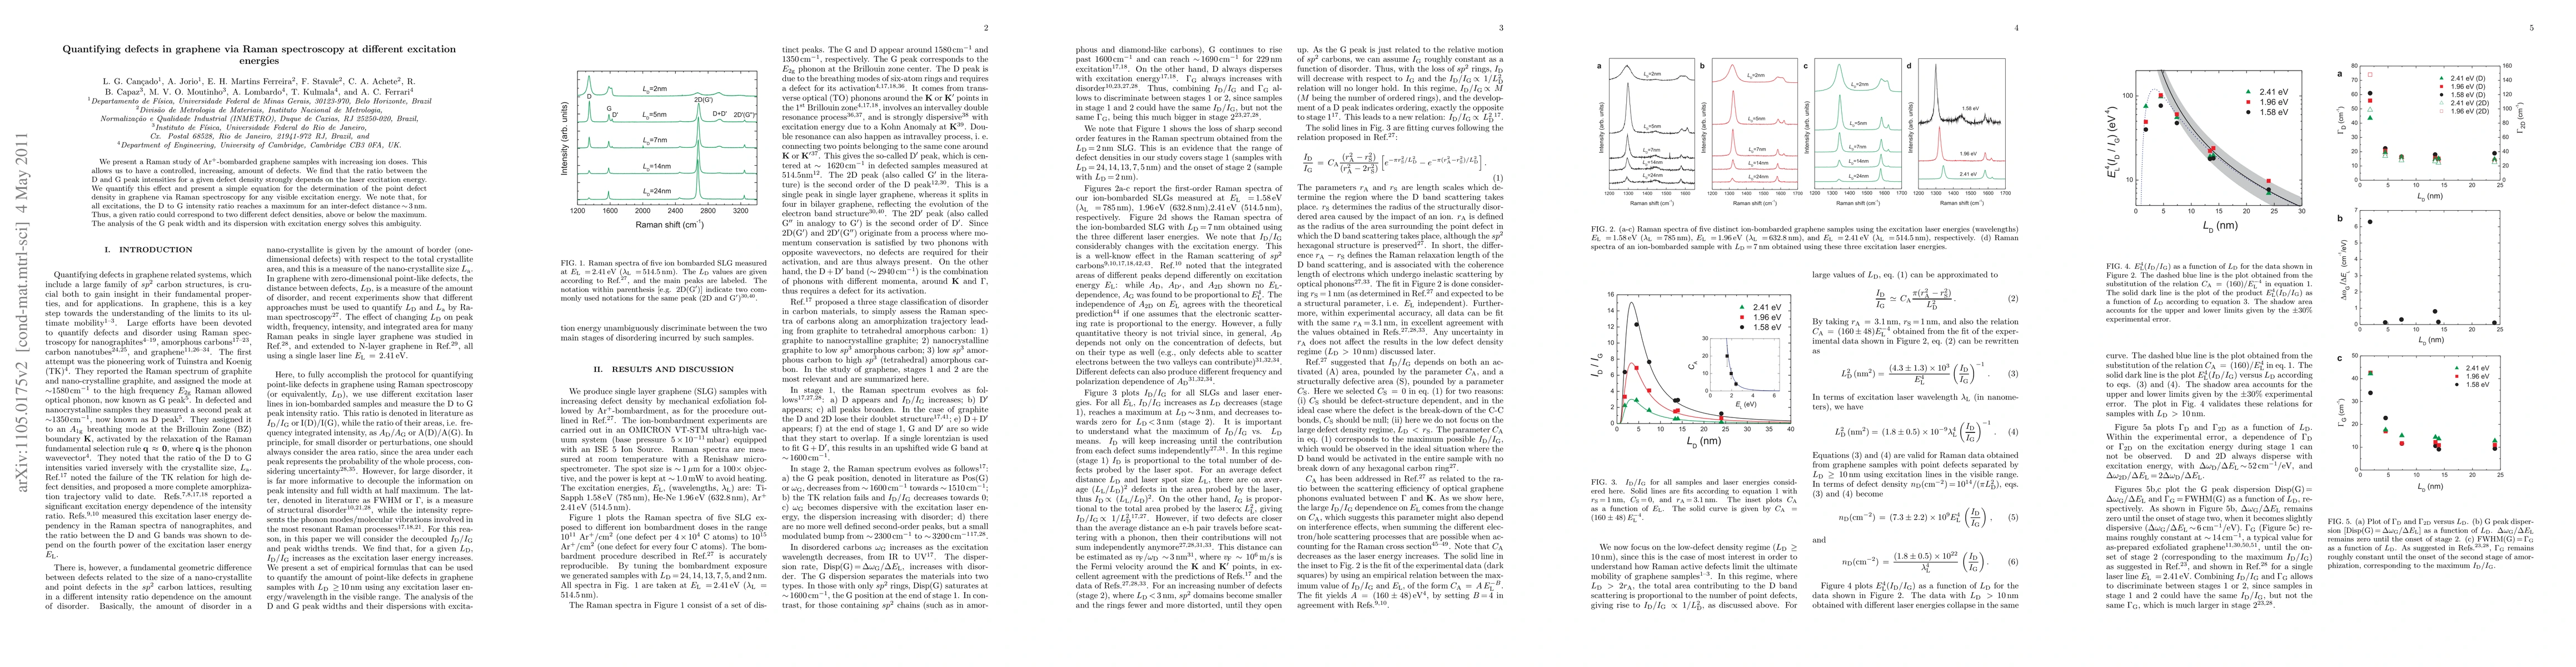
We present a Raman study of Ar(+)-bombarded graphene samples with increasing ion doses. This allows us to have a controlled, increasing, amount of defects. We find that the ratio between the D and G peak intensities for a given defect density strongly depends on the laser excitation energy. We quantify this effect and present a simple equation for the determination of the point defect density in graphene via Raman spectroscopy for any visible excitation energy. We note that, for all excitations, the D to G intensity ratio reaches a maximum for an inter-defect distance ~3nm. Thus, a given ratio could correspond to two different defect densities, above or below the maximum. The analysis of the G peak width and its dispersion with excitation energy solves this ambiguity.
AI Key Findings
Get AI-generated insights about this paper's methodology, results, significance, and more — seven facets brought into focus.
Impact
Paper Details
PDF Preview
Key Terms
Citation Network
Current paper (gray), citations (green), references (blue)
Display is limited for performance on very large graphs.
Discussion 0