Summary
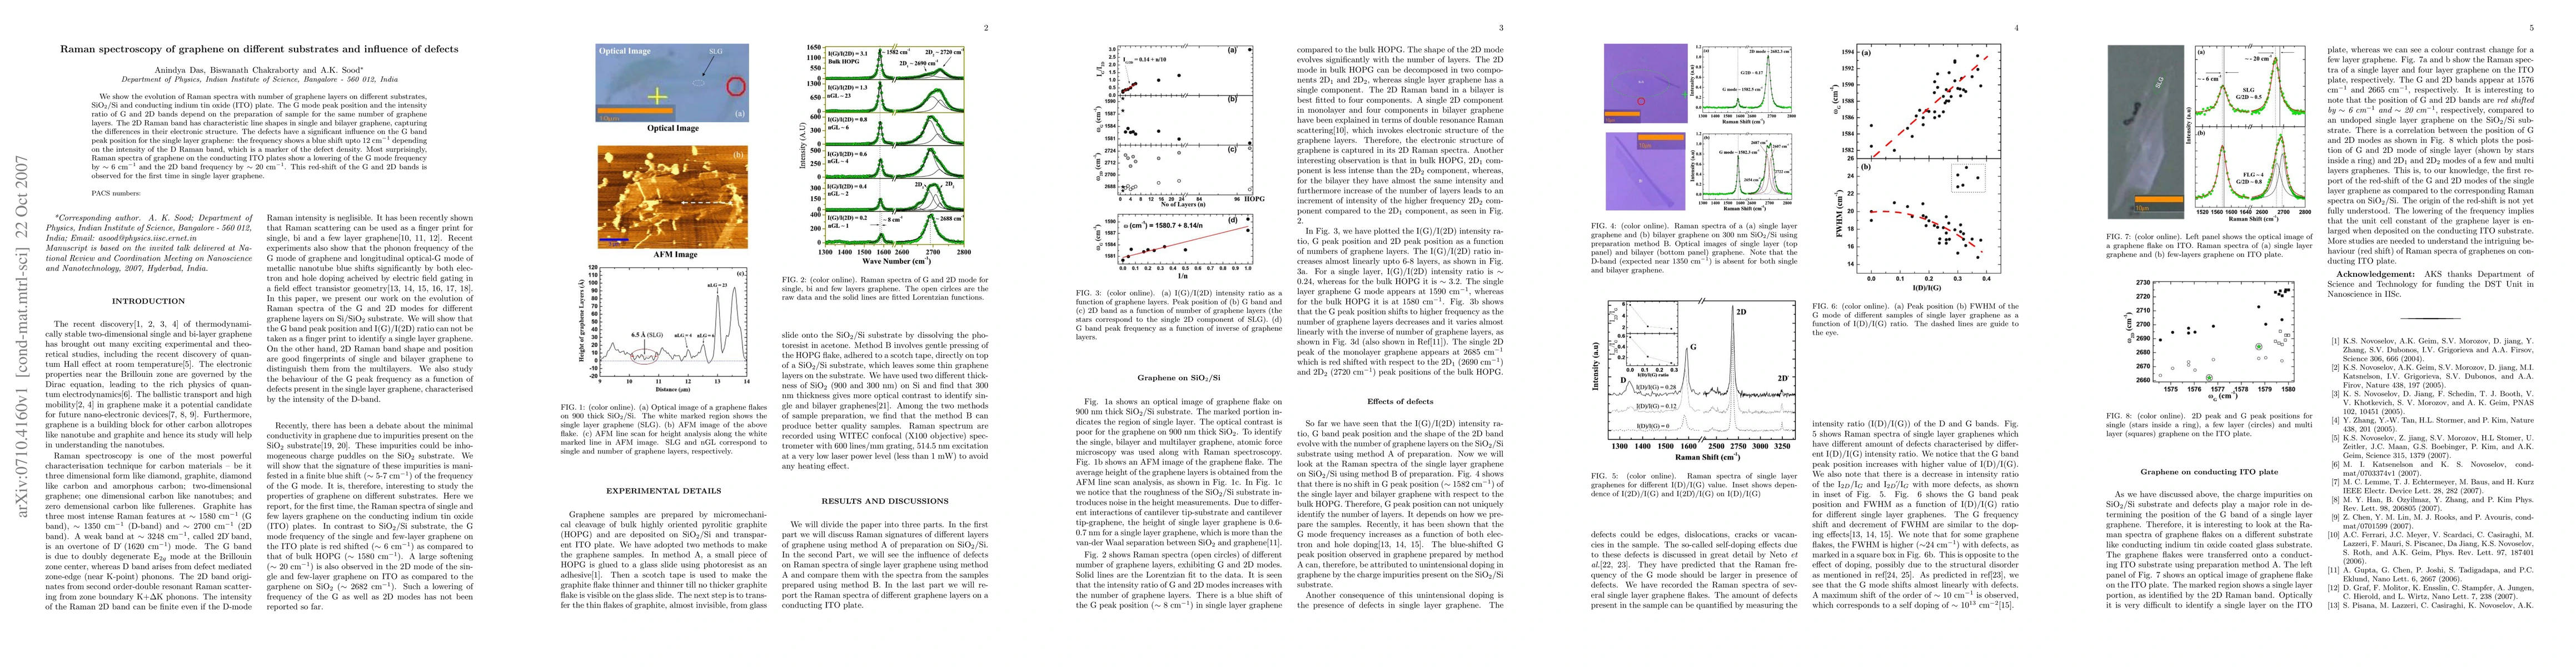
We show the evolution of Raman spectra with number of graphene layers on different substrates, SiO$_{2}$/Si and conducting indium tin oxide (ITO) plate. The G mode peak position and the intensity ratio of G and 2D bands depend on the preparation of sample for the same number of graphene layers. The 2D Raman band has characteristic line shapes in single and bilayer graphene, capturing the differences in their electronic structure. The defects have a significant influence on the G band peak position for the single layer graphene: the frequency shows a blue shift upto 12 cm$^{-1}$ depending on the intensity of the D Raman band, which is a marker of the defect density. Most surprisingly, Raman spectra of graphene on the conducting ITO plates show a lowering of the G mode frequency by $\sim$ 6 cm$^{-1}$ and the 2D band frequency by $\sim$ 20 cm$^{-1}$. This red-shift of the G and 2D bands is observed for the first time in single layer graphene.
AI Key Findings
Get AI-generated insights about this paper's methodology, results, and significance.
Paper Details
PDF Preview
Key Terms
Citation Network
Current paper (gray), citations (green), references (blue)
Display is limited for performance on very large graphs.
Similar Papers
Found 4 papers| Title | Authors | Year | Actions |
|---|
Comments (0)