Authors
Summary
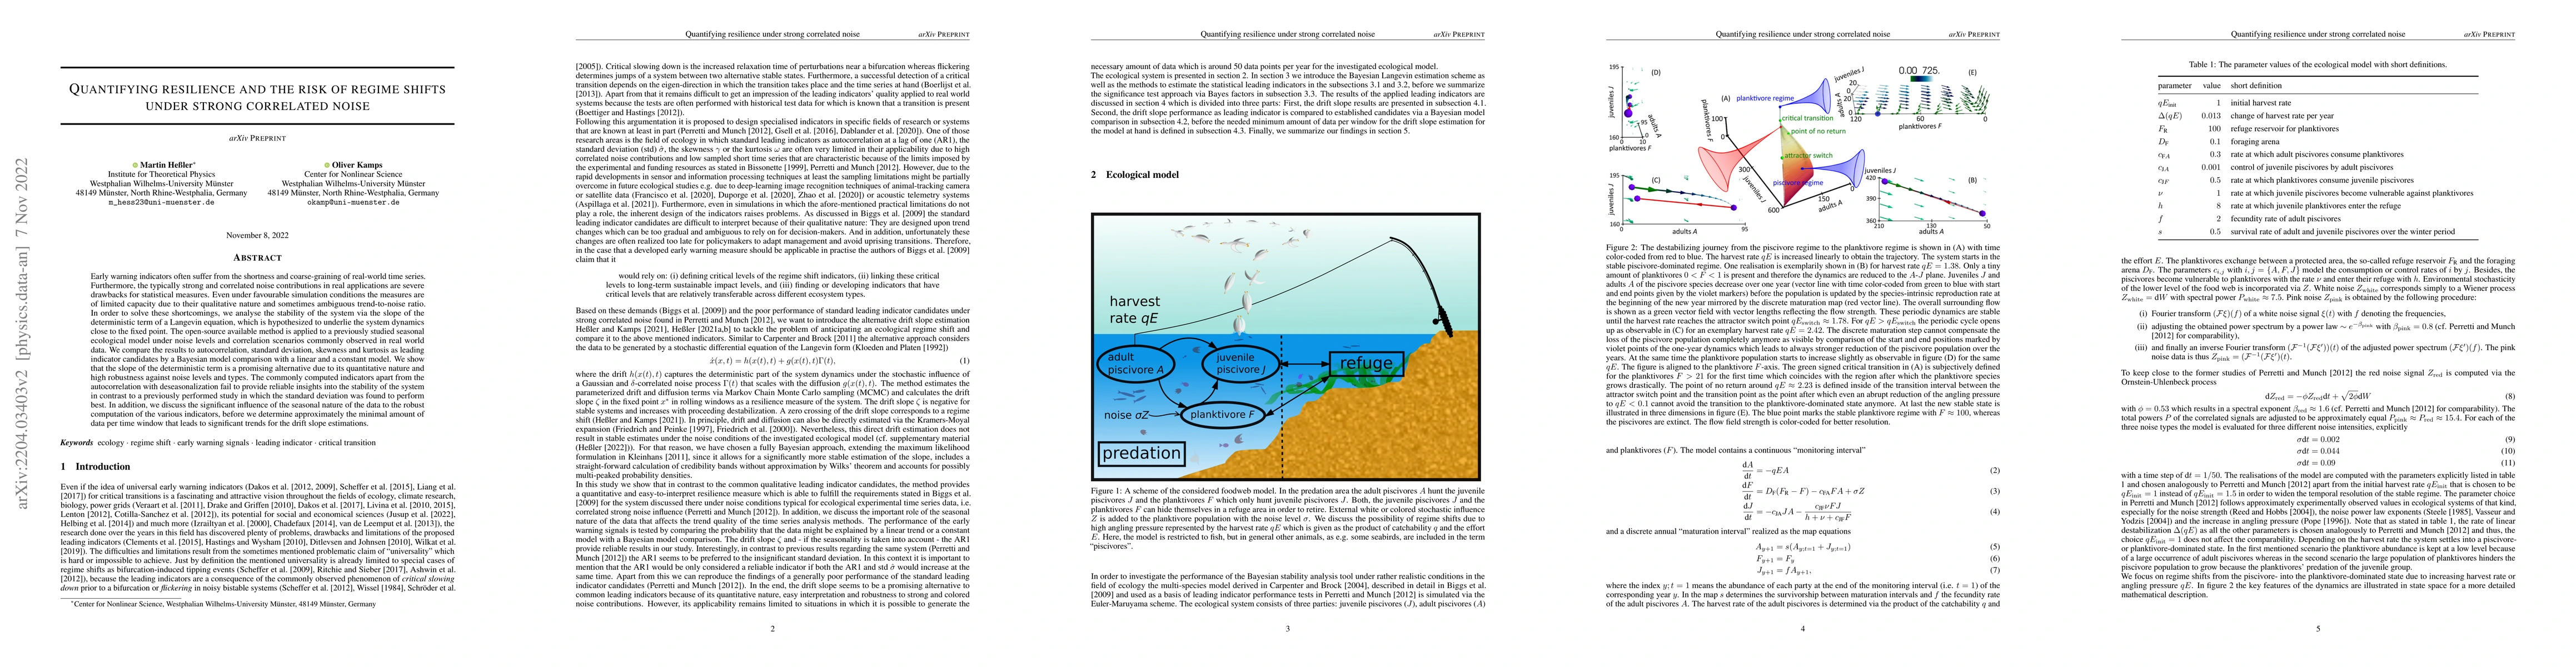
Early warning indicators often suffer from the shortness and coarse-graining of real-world time series. Furthermore, the typically strong and correlated noise contributions in real applications are severe drawbacks for statistical measures. Even under favourable simulation conditions the measures are of limited capacity due to their qualitative nature and sometimes ambiguous trend-to-noise ratio. In order to solve these shortcomings, we analyse the stability of the system via the slope of the deterministic term of a Langevin equation, which is hypothesized to underlie the system dynamics close to the fixed point. The open-source available method is applied to a previously studied seasonal ecological model under noise levels and correlation scenarios commonly observed in real world data. We compare the results to autocorrelation, standard deviation, skewness and kurtosis as leading indicator candidates by a Bayesian model comparison with a linear and a constant model. We show that the slope of the deterministic term is a promising alternative due to its quantitative nature and high robustness against noise levels and types. The commonly computed indicators apart from the autocorrelation with deseasonalization fail to provide reliable insights into the stability of the system in contrast to a previously performed study in which the standard deviation was found to perform best. In addition, we discuss the significant influence of the seasonal nature of the data to the robust computation of the various indicators, before we determine approximately the minimal amount of data per time window that leads to significant trends for the drift slope estimations.
AI Key Findings
Get AI-generated insights about this paper's methodology, results, and significance.
Paper Details
PDF Preview
Key Terms
Citation Network
Current paper (gray), citations (green), references (blue)
Display is limited for performance on very large graphs.
Similar Papers
Found 4 papers| Title | Authors | Year | Actions |
|---|
Comments (0)