RankAxis: Towards a Systematic Combination of Projection and Ranking in Multi-Attribute Data Exploration
Publication
Metrics
AI Quick Summary
RankAxis is a visual analytics system that integrates projection and ranking techniques to enhance multi-attribute data exploration. It aims to address issues like distorted layouts and non-intuitive effects by combining these methods, supported by a case study, expert feedback, and user study.
Paper Preview
Abstract
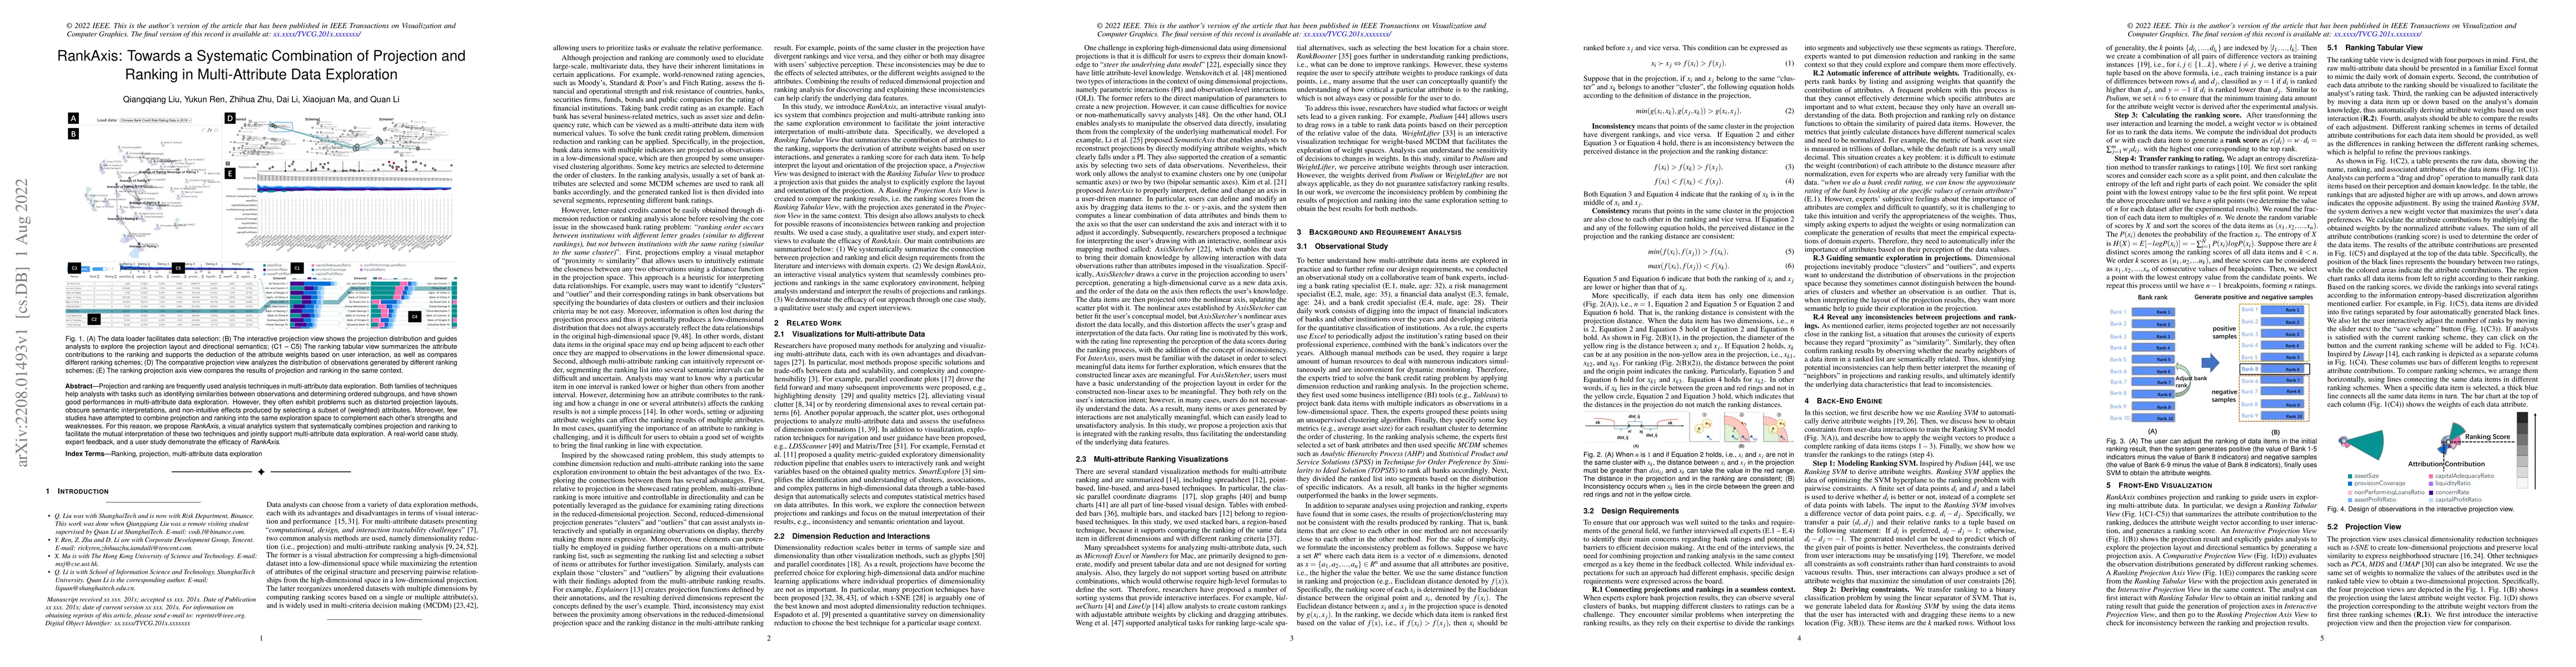
Projection and ranking are frequently used analysis techniques in multi-attribute data exploration. Both families of techniques help analysts with tasks such as identifying similarities between observations and determining ordered subgroups, and have shown good performances in multi-attribute data exploration. However, they often exhibit problems such as distorted projection layouts, obscure semantic interpretations, and non-intuitive effects produced by selecting a subset of (weighted) attributes. Moreover, few studies have attempted to combine projection and ranking into the same exploration space to complement each other's strengths and weaknesses. For this reason, we propose RankAxis, a visual analytics system that systematically combines projection and ranking to facilitate the mutual interpretation of these two techniques and jointly support multi-attribute data exploration. A real-world case study, expert feedback, and a user study demonstrate the efficacy of RankAxis.
AI Key Findings
Get AI-generated insights about this paper's methodology, results, significance, and more — seven facets brought into focus.
Impact
Paper Details
Authors
PDF Preview
Key Terms
Citation Network
Current paper (gray), citations (green), references (blue)
Display is limited for performance on very large graphs.
Discussion 0