Publication
Metrics
AI Quick Summary
SemanticAxis integrates feature distribution analysis and ranking of multi-attribute data through interactive semantic vector construction in two-dimensional space, enhancing understanding of both local and global patterns. The technique is validated through a visual analysis system, demonstrating its effectiveness in complex scenarios.
Paper Preview
Abstract
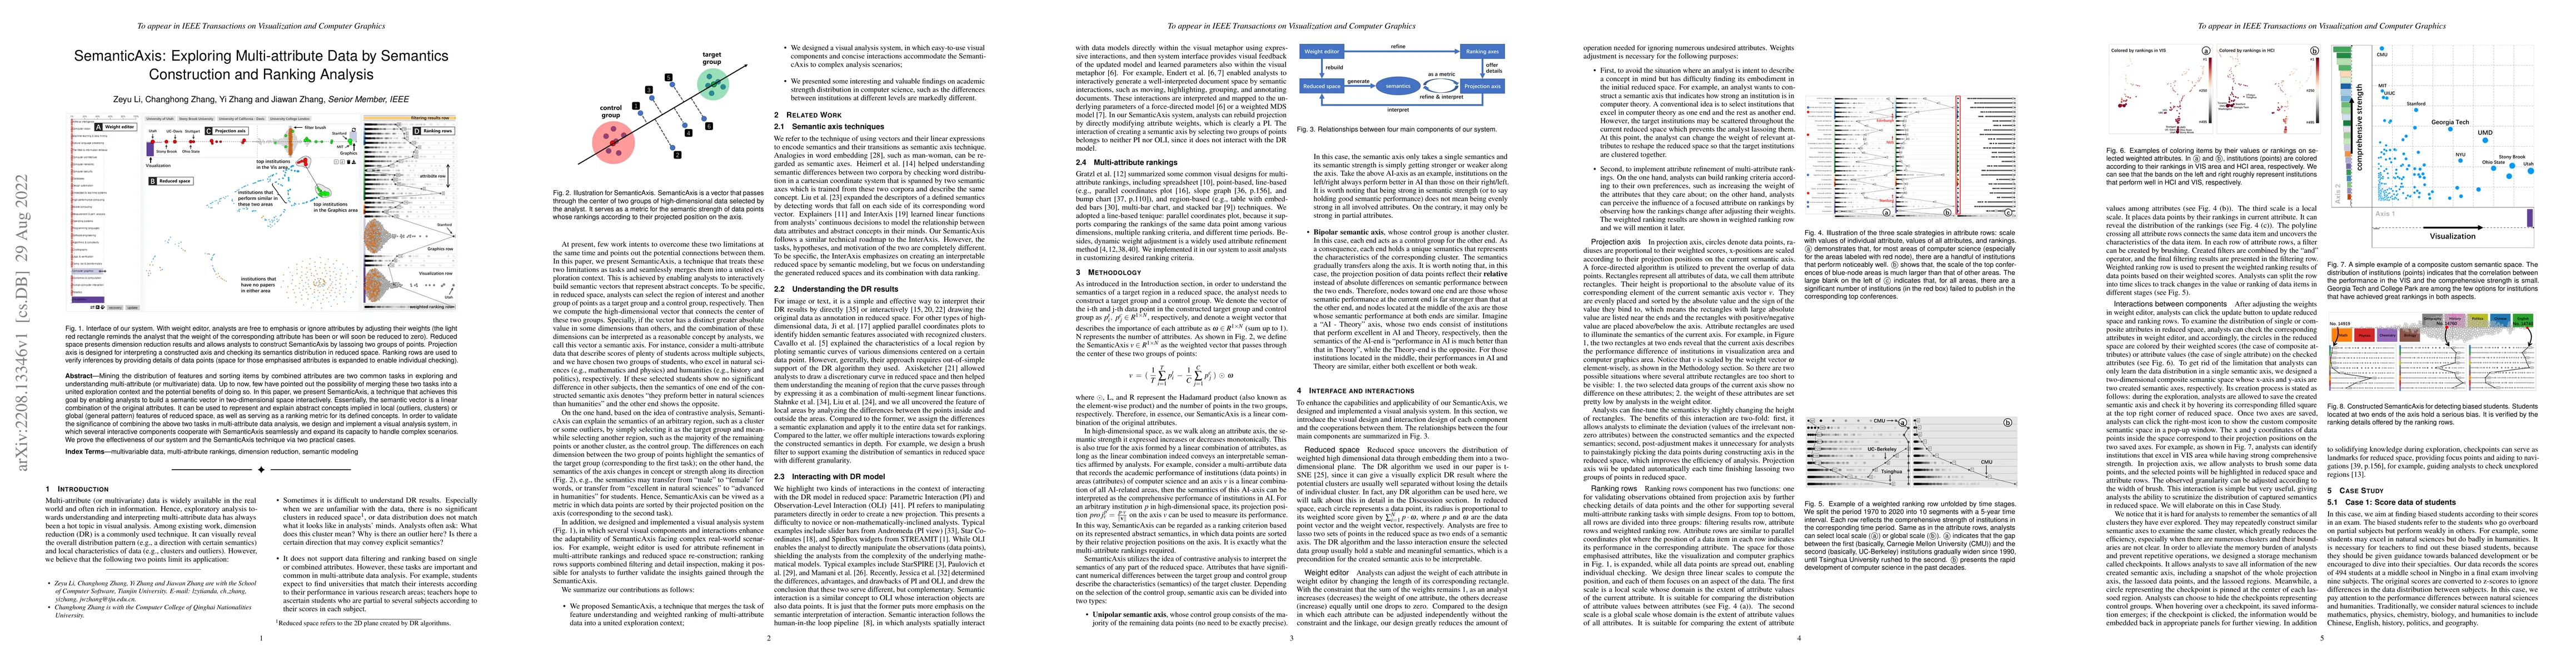
Mining the distribution of features and sorting items by combined attributes are two common tasks in exploring and understanding multi-attribute (or multivariate) data. Up to now, few have pointed out the possibility of merging these two tasks into a united exploration context and the potential benefits of doing so. In this paper, we present SemanticAxis, a technique that achieves this goal by enabling analysts to build a semantic vector in two-dimensional space interactively. Essentially, the semantic vector is a linear combination of the original attributes. It can be used to represent and explain abstract concepts implied in local (outliers, clusters) or global (general pattern) features of reduced space, as well as serving as a ranking metric for its defined concepts. In order to validate the significance of combining the above two tasks in multi-attribute data analysis, we design and implement a visual analysis system, in which several interactive components cooperate with SemanticAxis seamlessly and expand its capacity to handle complex scenarios. We prove the effectiveness of our system and the SemanticAxis technique via two practical cases.
AI Key Findings
Get AI-generated insights about this paper's methodology, results, significance, and more — seven facets brought into focus.
Impact
Paper Details
Authors
PDF Preview
Key Terms
Citation Network
Current paper (gray), citations (green), references (blue)
Display is limited for performance on very large graphs.
Discussion 0