Regression for Copula-linked Compound Distributions with Applications in Modeling Aggregate Insurance Claims
Publication
Metrics
AI Quick Summary
This paper presents a novel regression framework using copulas to model compound distributions for aggregate insurance claims, addressing the dependence between claim frequency and size. The proposed model is flexible and can handle incomplete data, demonstrating its effectiveness through both simulated and real property insurance data.
Paper Preview
Abstract
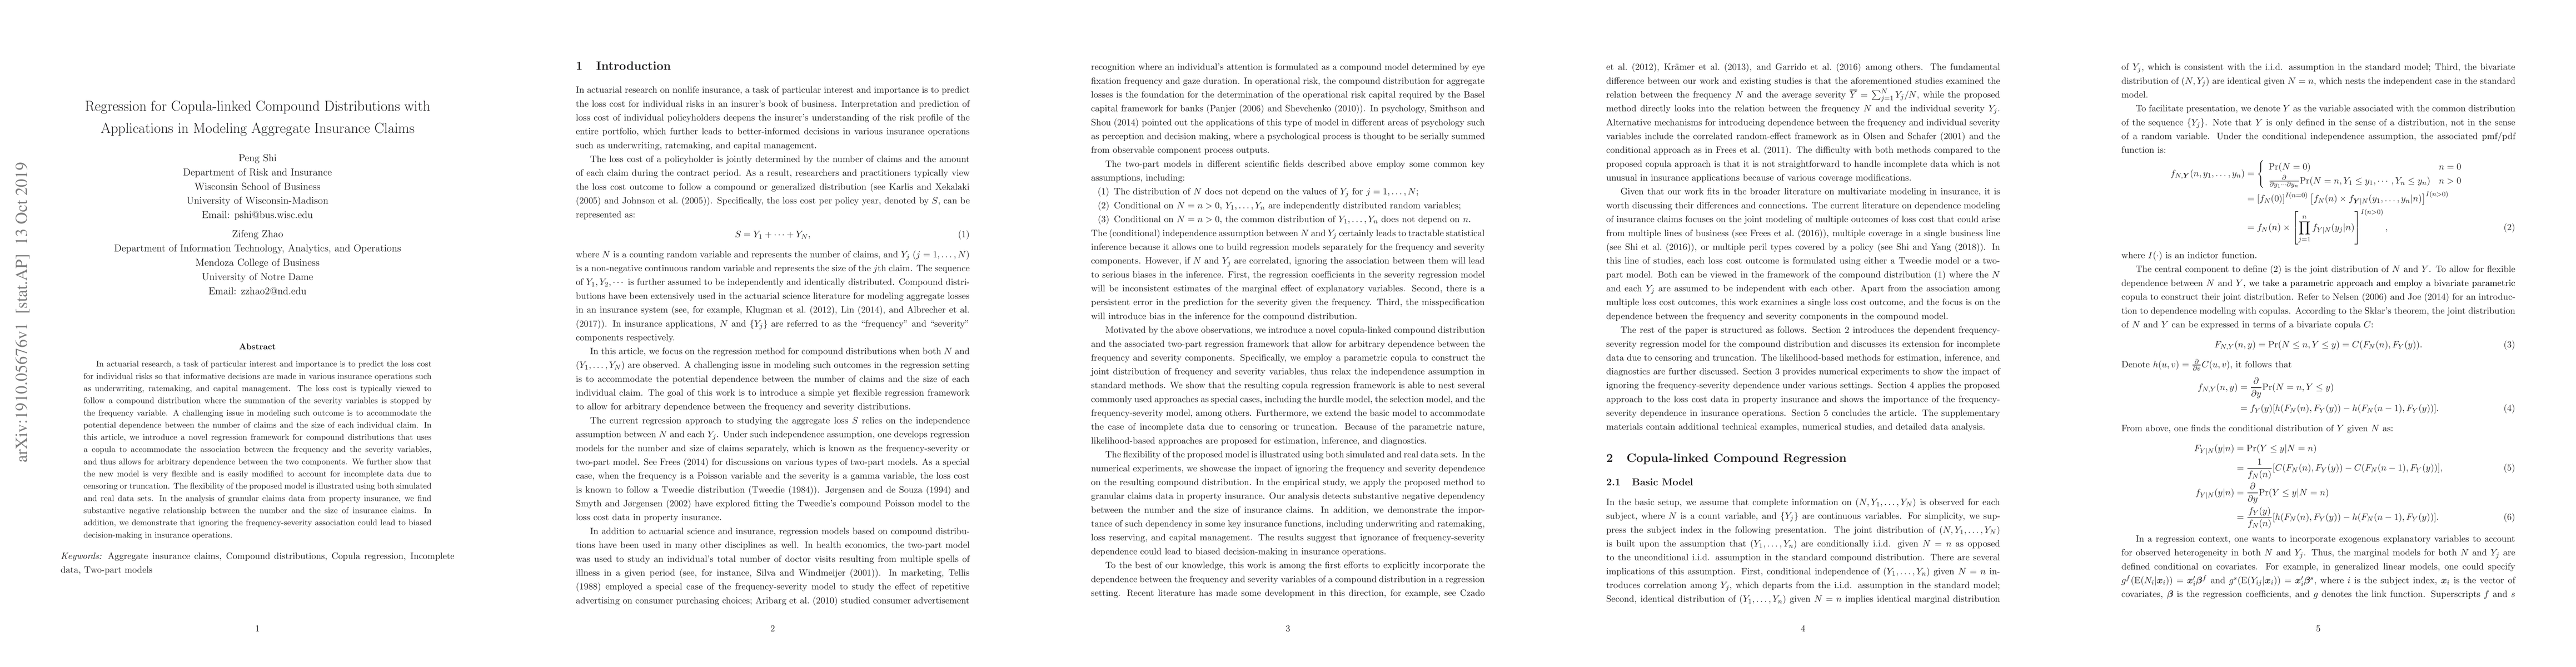
In actuarial research, a task of particular interest and importance is to predict the loss cost for individual risks so that informative decisions are made in various insurance operations such as underwriting, ratemaking, and capital management. The loss cost is typically viewed to follow a compound distribution where the summation of the severity variables is stopped by the frequency variable. A challenging issue in modeling such outcome is to accommodate the potential dependence between the number of claims and the size of each individual claim. In this article, we introduce a novel regression framework for compound distributions that uses a copula to accommodate the association between the frequency and the severity variables, and thus allows for arbitrary dependence between the two components. We further show that the new model is very flexible and is easily modified to account for incomplete data due to censoring or truncation. The flexibility of the proposed model is illustrated using both simulated and real data sets. In the analysis of granular claims data from property insurance, we find substantive negative relationship between the number and the size of insurance claims. In addition, we demonstrate that ignoring the frequency-severity association could lead to biased decision-making in insurance operations.
AI Key Findings
Get AI-generated insights about this paper's methodology, results, significance, and more — seven facets brought into focus.
Impact
Paper Details
Authors
PDF Preview
Key Terms
Citation Network
Current paper (gray), citations (green), references (blue)
Display is limited for performance on very large graphs.
Discussion 0