Regularised Spectral Estimation for High-Dimensional Point Processes
Publication
Metrics
AI Quick Summary
This paper introduces a novel regularised spectral estimation method for high-dimensional multivariate point processes, such as neural spike trains. The proposed approach addresses the computational challenges inherent in estimating the spectral density matrix and demonstrates its effectiveness through synthetic data and real neuroscience applications, enabling the inference of brain connectivity.
Paper Preview
Abstract
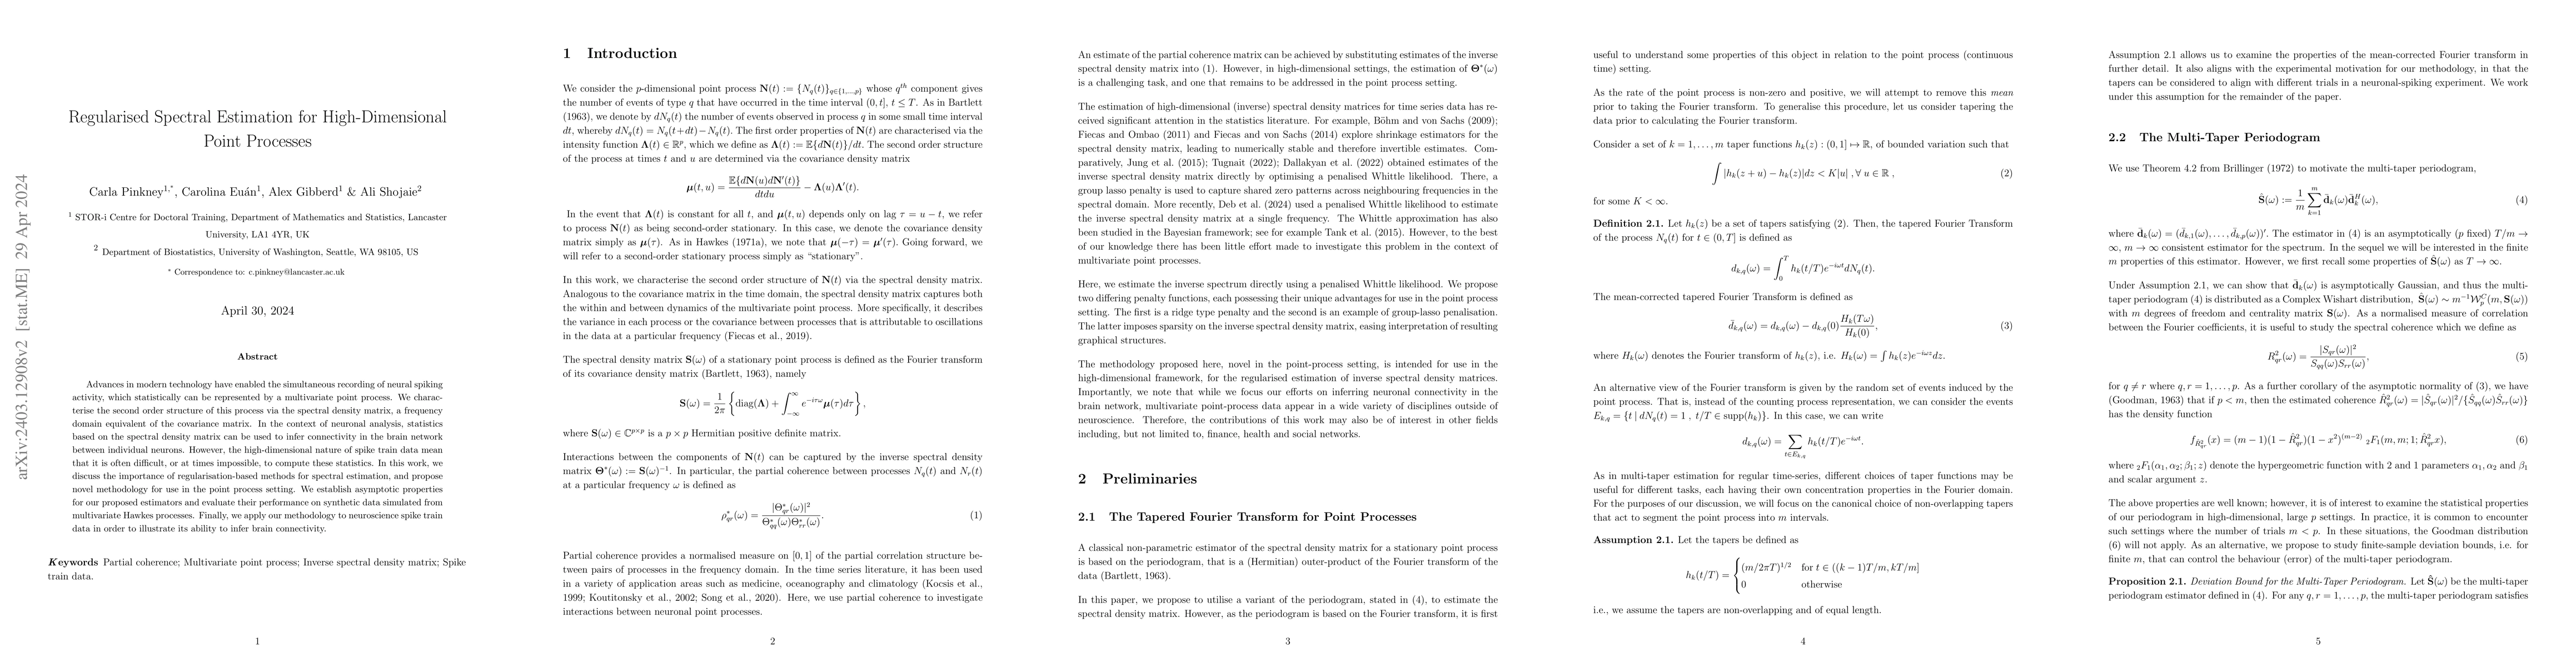
Advances in modern technology have enabled the simultaneous recording of neural spiking activity, which statistically can be represented by a multivariate point process. We characterise the second order structure of this process via the spectral density matrix, a frequency domain equivalent of the covariance matrix. In the context of neuronal analysis, statistics based on the spectral density matrix can be used to infer connectivity in the brain network between individual neurons. However, the high-dimensional nature of spike train data mean that it is often difficult, or at times impossible, to compute these statistics. In this work, we discuss the importance of regularisation-based methods for spectral estimation, and propose novel methodology for use in the point process setting. We establish asymptotic properties for our proposed estimators and evaluate their performance on synthetic data simulated from multivariate Hawkes processes. Finally, we apply our methodology to neuroscience spike train data in order to illustrate its ability to infer brain connectivity.
AI Key Findings
Get AI-generated insights about this paper's methodology, results, significance, and more — seven facets brought into focus.
Impact
Paper Details
Authors
PDF Preview
Key Terms
Citation Network
Current paper (gray), citations (green), references (blue)
Display is limited for performance on very large graphs.
Discussion 0