Publication
Metrics
AI Quick Summary
This paper proposes a robust multivariate and functional archetypal analysis using M-estimators to handle outliers, demonstrating its application in financial time series analysis of S&P 500 companies. The new method is shown to be more effective than previous approaches, allowing non-experts to interpret complex data easily.
Paper Preview
Abstract
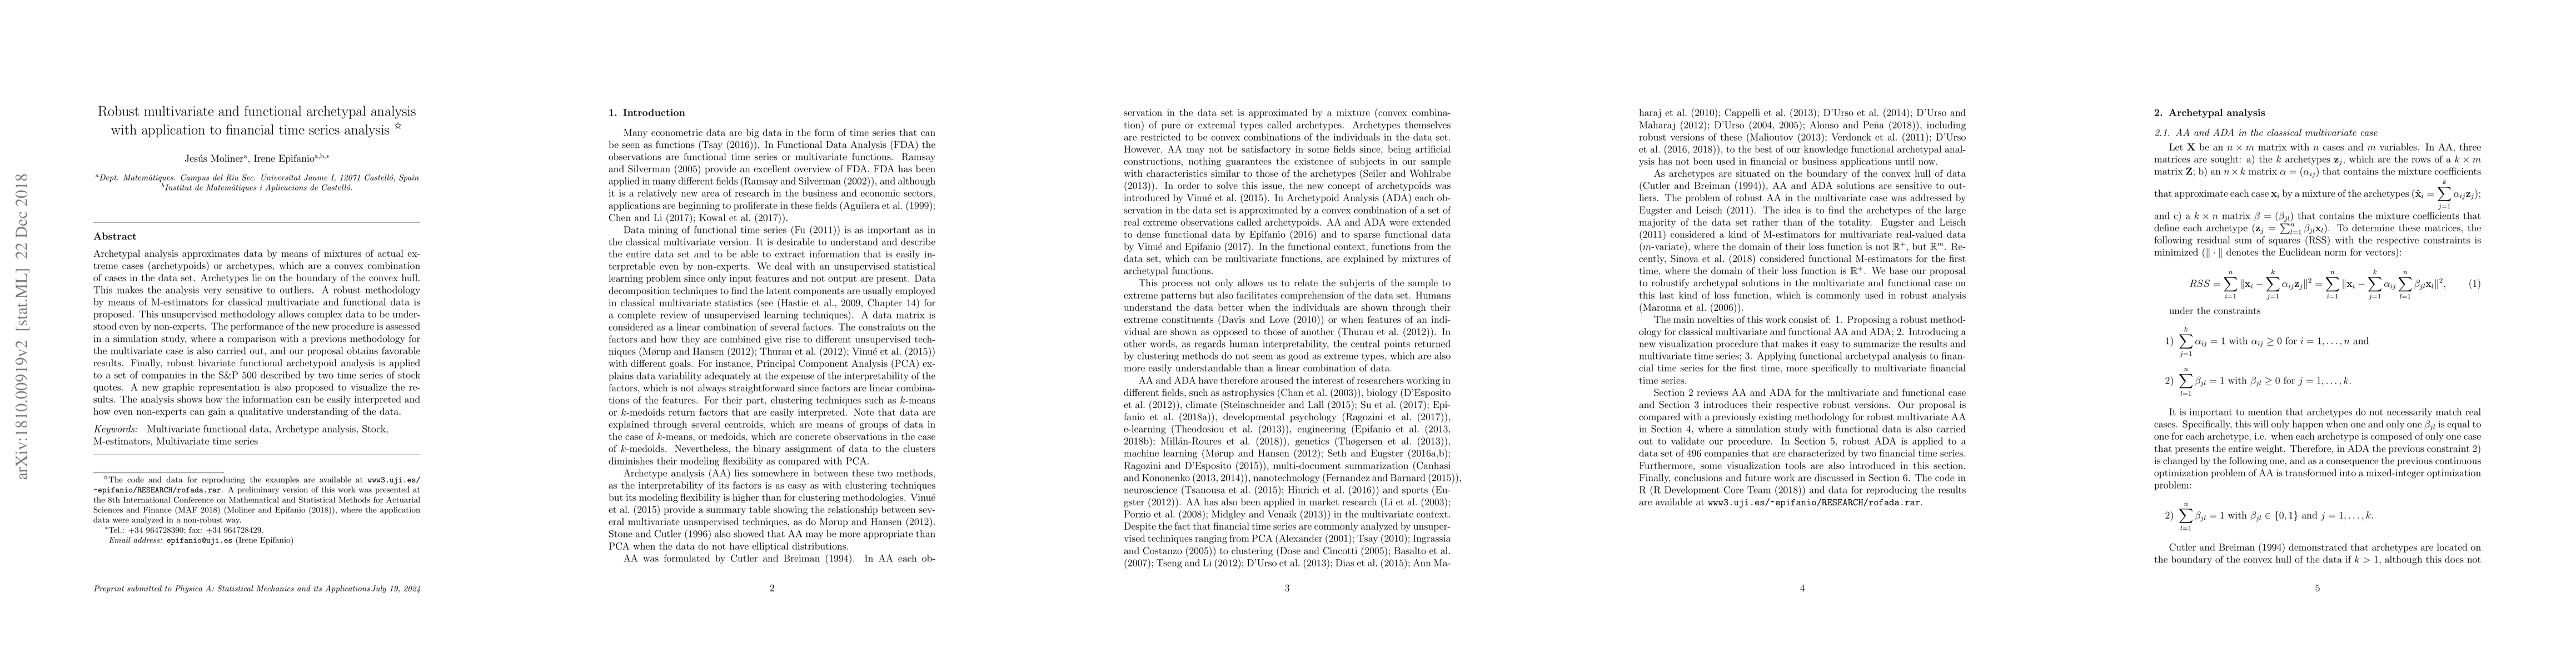
Archetypal analysis approximates data by means of mixtures of actual extreme cases (archetypoids) or archetypes, which are a convex combination of cases in the data set. Archetypes lie on the boundary of the convex hull. This makes the analysis very sensitive to outliers. A robust methodology by means of M-estimators for classical multivariate and functional data is proposed. This unsupervised methodology allows complex data to be understood even by non-experts. The performance of the new procedure is assessed in a simulation study, where a comparison with a previous methodology for the multivariate case is also carried out, and our proposal obtains favorable results. Finally, robust bivariate functional archetypoid analysis is applied to a set of companies in the S\&P 500 described by two time series of stock quotes. A new graphic representation is also proposed to visualize the results. The analysis shows how the information can be easily interpreted and how even non-experts can gain a qualitative understanding of the data.
AI Key Findings
Get AI-generated insights about this paper's methodology, results, significance, and more — seven facets brought into focus.
Impact
Paper Details
PDF Preview
Key Terms
Citation Network
Current paper (gray), citations (green), references (blue)
Display is limited for performance on very large graphs.
Discussion 0