Publication
Metrics
Paper Preview
Abstract
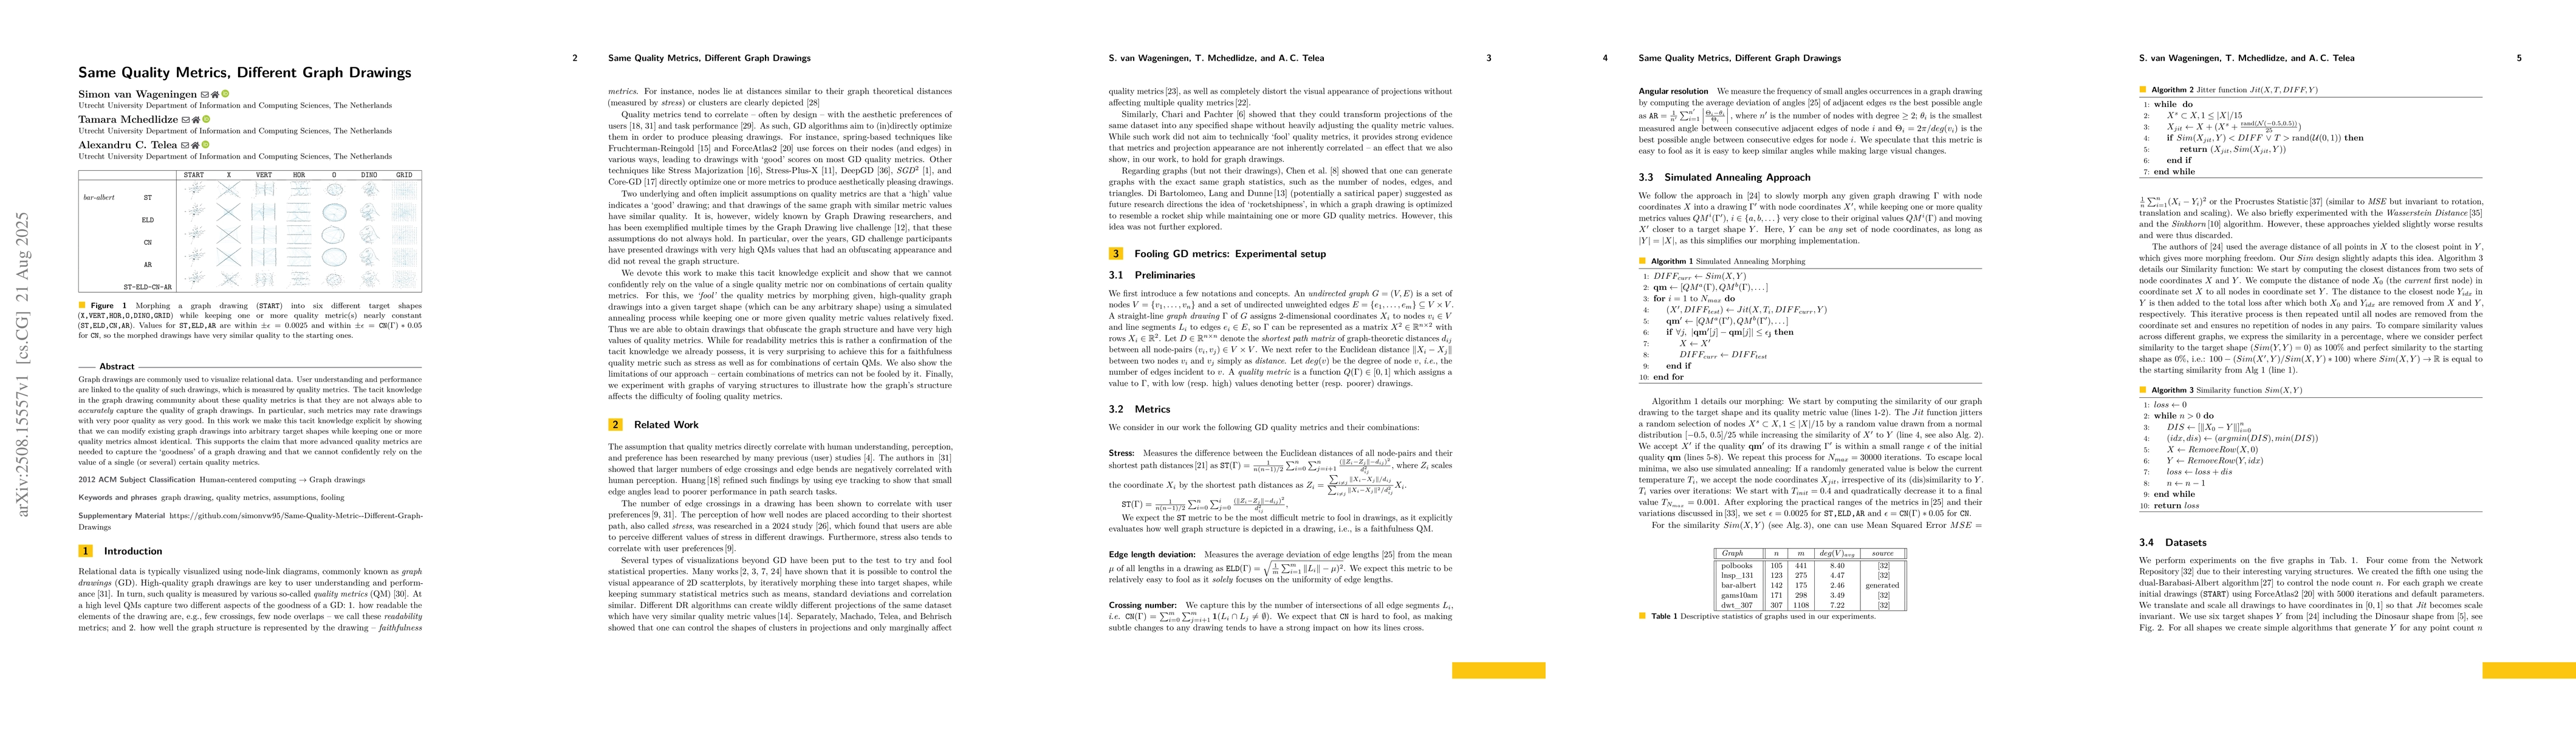
Graph drawings are commonly used to visualize relational data. User understanding and performance are linked to the quality of such drawings, which is measured by quality metrics. The tacit knowledge in the graph drawing community about these quality metrics is that they are not always able to accurately capture the quality of graph drawings. In particular, such metrics may rate drawings with very poor quality as very good. In this work we make this tacit knowledge explicit by showing that we can modify existing graph drawings into arbitrary target shapes while keeping one or more quality metrics almost identical. This supports the claim that more advanced quality metrics are needed to capture the 'goodness' of a graph drawing and that we cannot confidently rely on the value of a single (or several) certain quality metrics.
AI Key Findings
Get AI-generated insights about this paper's methodology, results, significance, and more — seven facets brought into focus.
Discussion 0