Same Stats, Different Graphs (Graph Statistics and Why We Need Graph Drawings)
Publication
Metrics
Paper Preview
Abstract
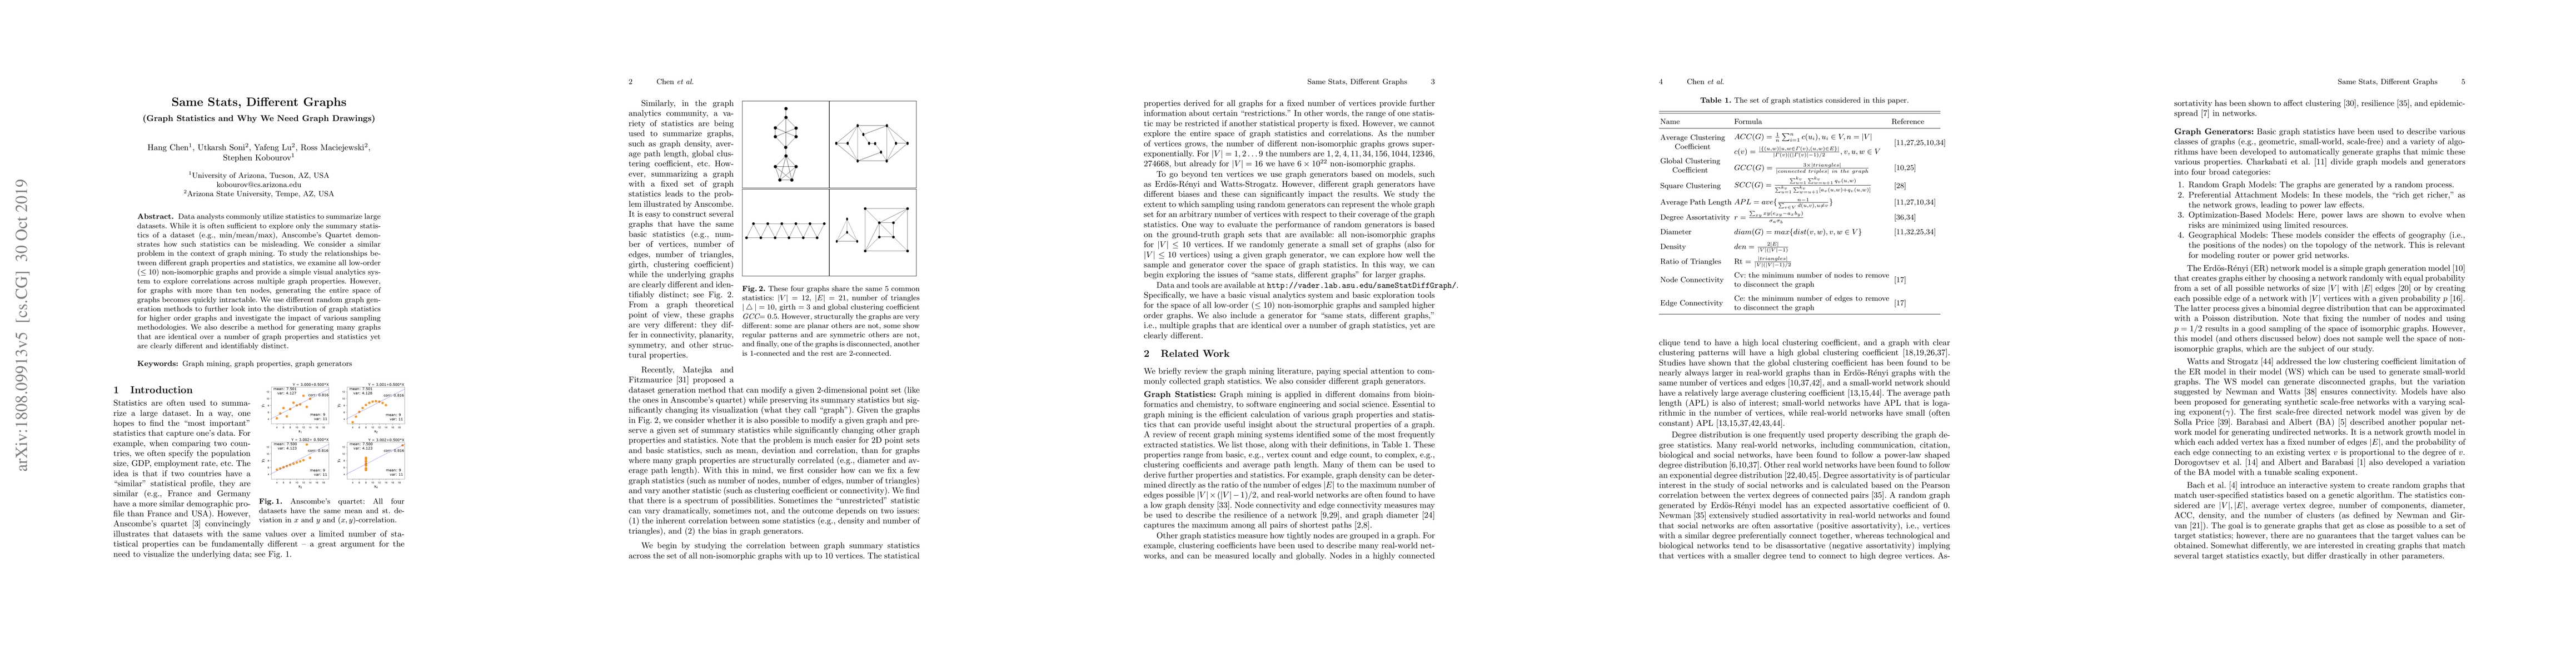
Data analysts commonly utilize statistics to summarize large datasets. While it is often sufficient to explore only the summary statistics of a dataset (e.g., min/mean/max), Anscombe's Quartet demonstrates how such statistics can be misleading. Graph mining has a similar problem in that graph statistics (e.g., density, connectivity, clustering coefficient) may not capture all of the critical properties of a given graph. To study the relationships between different graph properties and statistics, we examine all low-order (<= 10) non-isomorphic graphs and provide a simple visual analytics system to explore correlations across multiple graph properties. However, for graphs with more than ten nodes, generating the entire space of graphs becomes quickly intractable. We use different random graph generation methods to further look into the distribution of graph statistics for higher order graphs and investigate the impact of various sampling methodologies. We also describe a method for generating many graphs that are identical over a number of graph properties and statistics yet are clearly different and identifiably distinct.
AI Key Findings
Get AI-generated insights about this paper's methodology, results, significance, and more — seven facets brought into focus.
Impact
Paper Details
PDF Preview
Key Terms
Citation Network
Current paper (gray), citations (green), references (blue)
Display is limited for performance on very large graphs.
Discussion 0