Publication
Metrics
Quick Actions
Paper Preview
Abstract
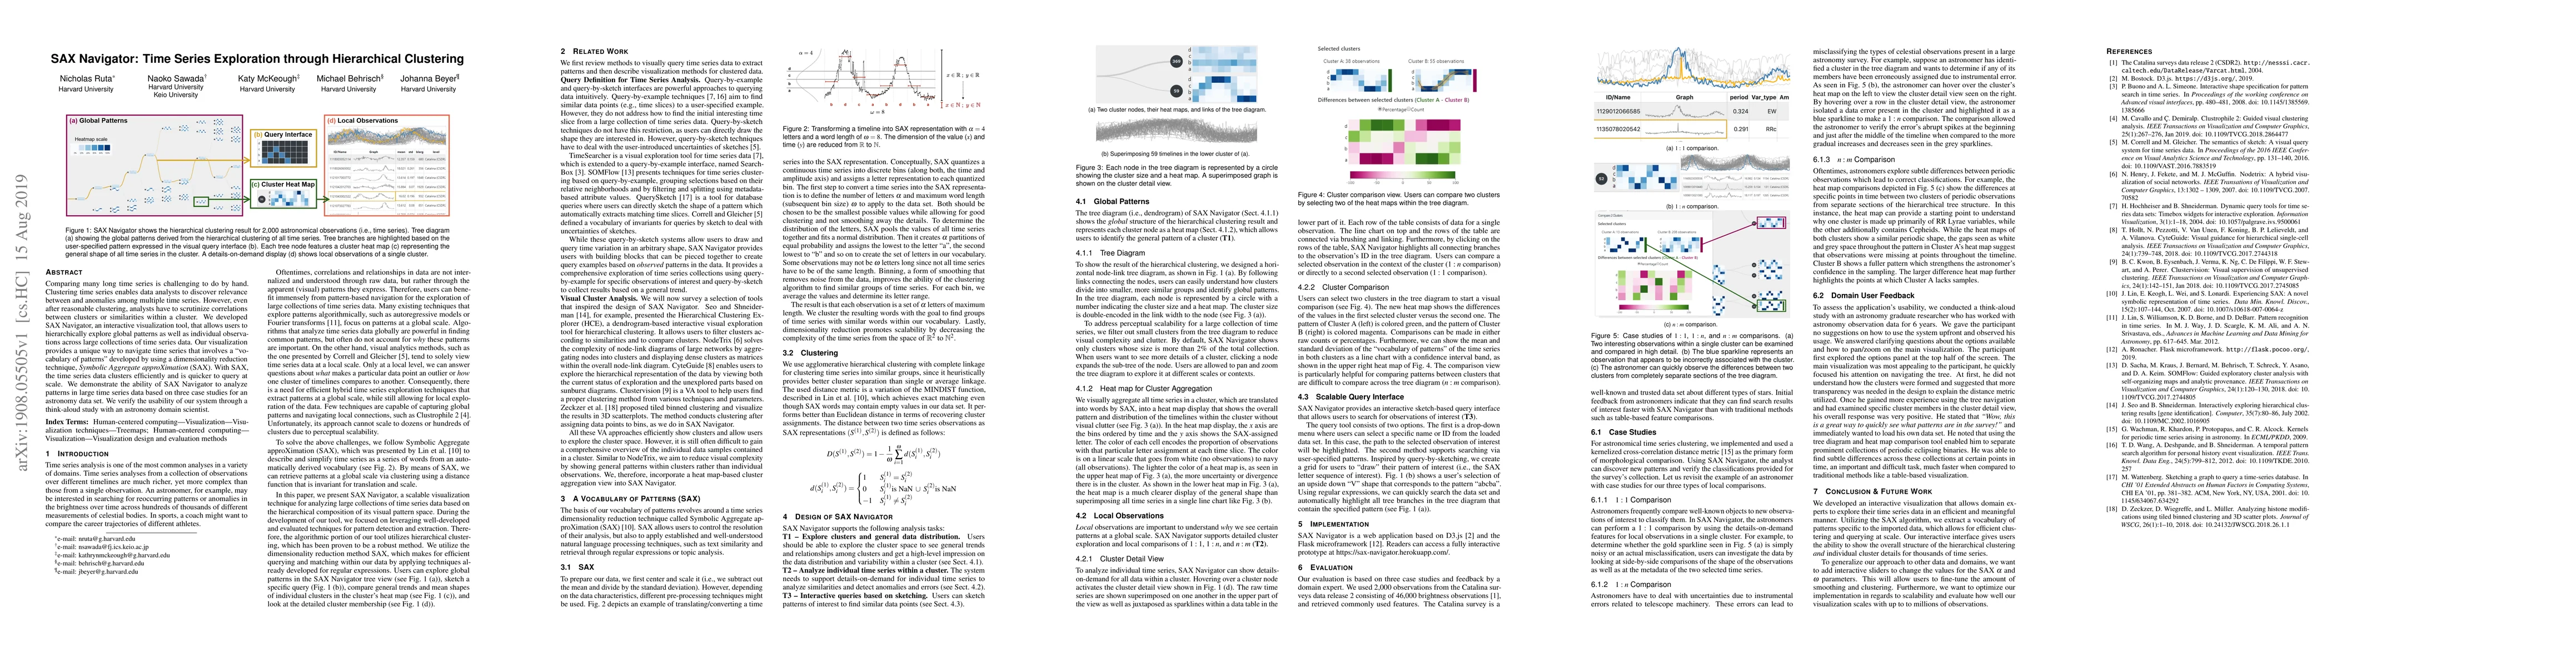
Comparing many long time series is challenging to do by hand. Clustering time series enables data analysts to discover relevance between and anomalies among multiple time series. However, even after reasonable clustering, analysts have to scrutinize correlations between clusters or similarities within a cluster. We developed SAX Navigator, an interactive visualization tool, that allows users to hierarchically explore global patterns as well as individual observations across large collections of time series data. Our visualization provides a unique way to navigate time series that involves a "vocabulary of patterns" developed by using a dimensionality reduction technique,Symbolic Aggregate approXimation(SAX). With SAX, the time series data clusters efficiently and is quicker to query at scale. We demonstrate the ability of SAX Navigator to analyze patterns in large time series data based on three case studies for an astronomy data set. We verify the usability of our system through a think-aloud study with an astronomy domain scientist.
AI Key Findings
Get AI-generated insights about this paper's methodology, results, and significance.
Paper Details
How to Cite This Paper
@article{beyer2019sax,
  title         = {SAX Navigator: Time Series Exploration through Hierarchical Clustering},
  author        = {Beyer, Johanna and McKeough, Katy and Behrisch, Michael and others},
  year          = {2019},
  eprint        = {1908.05505},
  archivePrefix = {arXiv},
  primaryClass  = {cs.HC},
}Beyer, J., McKeough, K., Behrisch, M., Sawada, N., & Ruta, N. (2019). SAX Navigator: Time Series Exploration through Hierarchical Clustering. arXiv. https://arxiv.org/abs/1908.05505Beyer, Johanna, et al. "SAX Navigator: Time Series Exploration through Hierarchical Clustering." arXiv, 2019, arxiv.org/abs/1908.05505.PDF Preview
Key Terms
Citation Network
Current paper (gray), citations (green), references (blue)
Display is limited for performance on very large graphs.
Similar Papers
Found 4 papersConstructing hierarchical time series through clustering: Is there an optimal way for forecasting?
Bohan Zhang, Anastasios Panagiotelis, Han Li
Granger Causality Based Hierarchical Time Series Clustering for State Estimation
Soumik Sarkar, Homagni Saha, Gregor P. Henze et al.
Efficient Forecasting of Large Scale Hierarchical Time Series via Multilevel Clustering
Joydeep Ghosh, Xing Han, Tongzheng Ren et al.
Graph-based Time Series Clustering for End-to-End Hierarchical Forecasting
Andrea Cini, Danilo Mandic, Cesare Alippi
| Title | Authors | Year | Actions |
|---|
Comments (0)