Quick Summary:

The paper introduces Scatteract, an automated system using deep learning and optical character recognition to extract numerical data from scatter plots, enabling further data modeling. The method achieves successful extraction in 89% of tested plots, marking the first fully automatic approach for scatter plots.

Summary

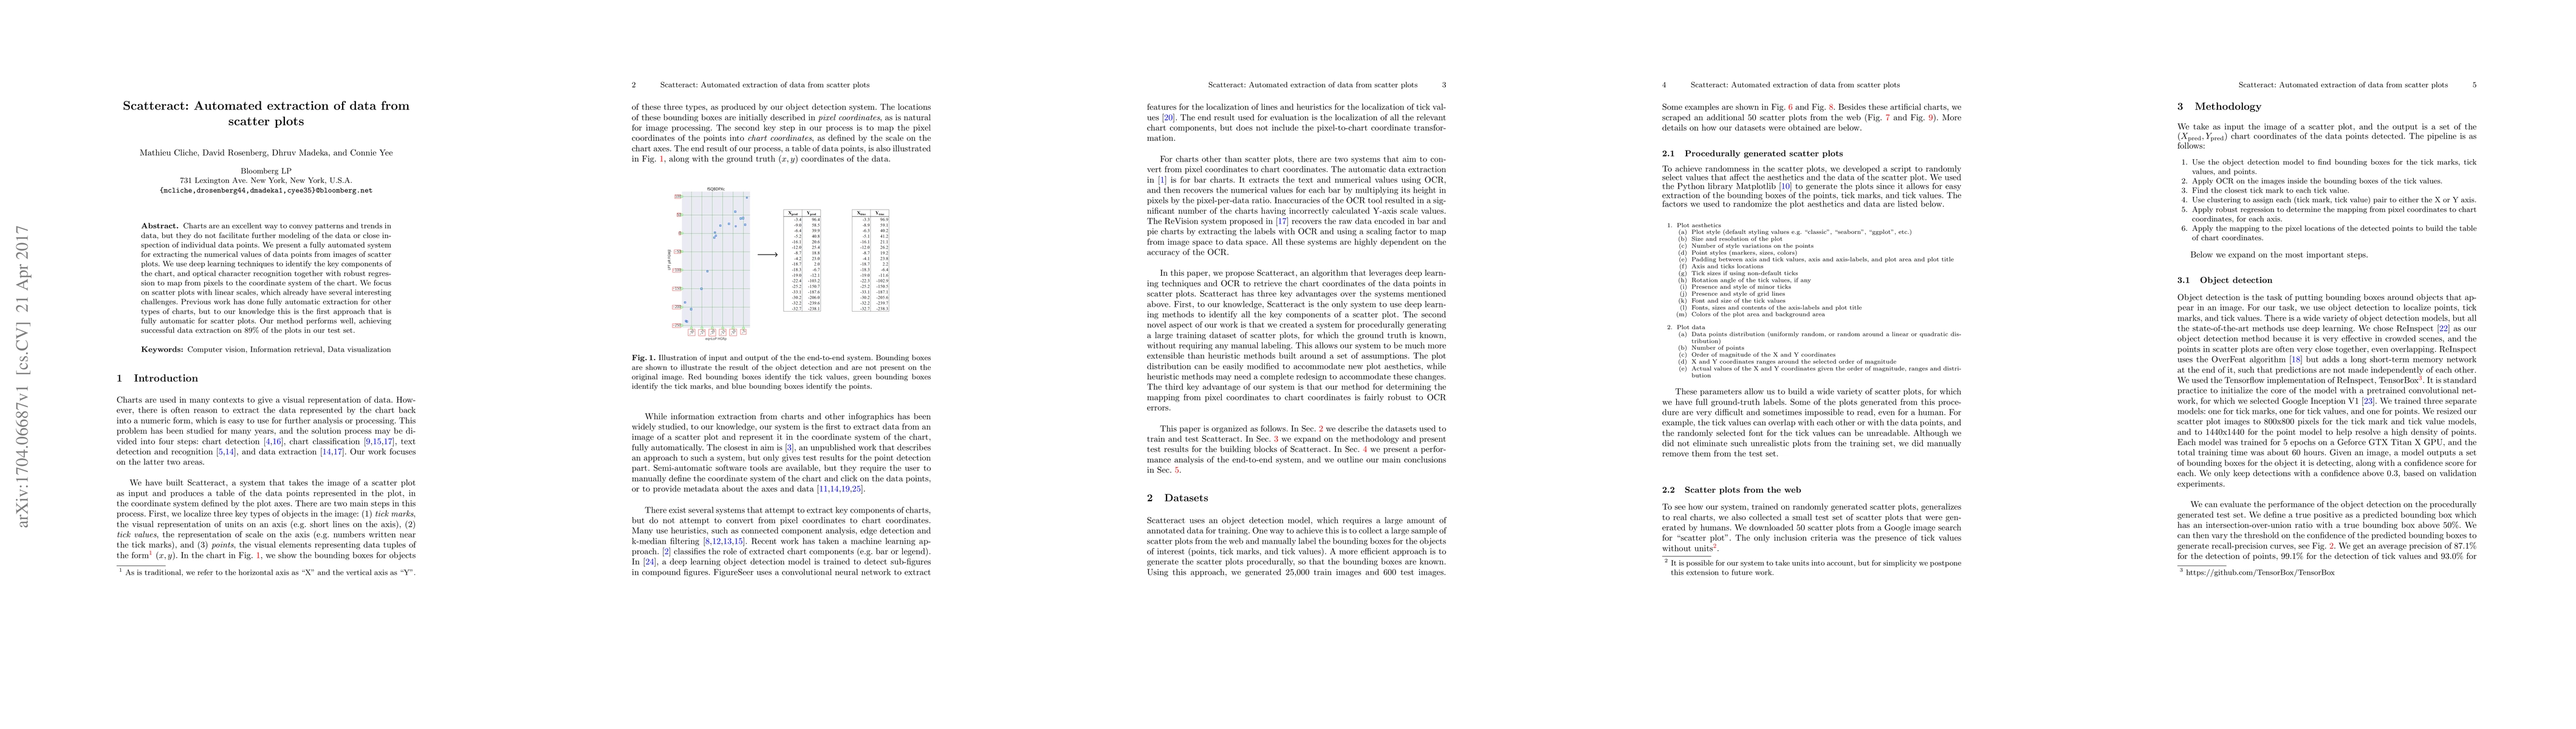
Charts are an excellent way to convey patterns and trends in data, but they do not facilitate further modeling of the data or close inspection of individual data points. We present a fully automated system for extracting the numerical values of data points from images of scatter plots. We use deep learning techniques to identify the key components of the chart, and optical character recognition together with robust regression to map from pixels to the coordinate system of the chart. We focus on scatter plots with linear scales, which already have several interesting challenges. Previous work has done fully automatic extraction for other types of charts, but to our knowledge this is the first approach that is fully automatic for scatter plots. Our method performs well, achieving successful data extraction on 89% of the plots in our test set.

AI Key Findings

Get AI-generated insights about this paper's methodology, results, and significance.

Paper Details

PDF Preview

Download PDF

Key Terms

scatter (0.348)
scatter (0.327)
fully (0.240)
automatic (0.240)
automatic (0.238)
extraction (0.235)
extraction (0.229)
fully (0.225)
points (0.186)
points (0.178)
data (0.174)
inspection (0.174)
data (0.167)
pixels (0.162)
extracting (0.159)
extracting (0.158)
trends (0.156)
learning techniques (0.155)
trends (0.154)
coordinate (0.150)

Citation Network

Current paper (gray), citations (green), references (blue)

Current Paper
Citations
References
Click to view
Title Authors Year Actions
Semantic Plagiarism Detection of Figures in Scholarly Documents: A Conceptual Framework
Hafsa Batool, S. Islam, Naeem Janjua
2024
View Paper
A Comprehensive Approach to Graph Analysis and Equation Decoding
Aniket Patil, Shreyas Patil, Yuvraj Patil, Tushar R. Jadhav, Milind S. Patil
2024
View Paper
From Detection to Application: Recent Advances in Understanding Scientific Tables and Figures
Jiani Huang, Haihua Chen, Fengchang Yu, Wei Lu
2024
View Paper
Reconstructing High-Dimensional Datasets From Their Bivariate Projections
Eli Dugan, Klaus Mueller
2023
View Paper
OsmLocator: locating overlapping scatter marks with a non-training generative perspective
Yuming Qiu, Aleksandra Pižurica, Qi Ming, Nicolas Nadisic
2023
View Paper
Behavioral analysis of bar charts in documents via stochastic petri-net modeling
M. Alexiou, N. Bourbakis
2023
View Paper
Automated identification of kinetics model in elastomer vulcanization using a rheometer MDR and Rubber-K pattern recognition software
S. Gómez-Jiménez, T. Saucedo-Anaya, E.A. López-Baltazar, A. Robles-Guerrero
2023
View Paper
LYLAA: A Lightweight YOLO based Legend and Axis Analysis method for CHART-Infographics
Hadia Showkat Kawoosa, Muhammad Suhaib Kanroo, Puneet Goyal
2023
View Paper
An extensible point-based method for data chart value detection
Carlos Soto, Shinjae Yoo
2023
View Paper
Making Data-Driven Articles more Accessible: An Active Preference Learning Approach to Data Fact Personalization
Yanan Wang, Yea-Seul Kim
2023
View Paper
Foundation Model for Material Science
Seiji Takeda, Akihiro Kishimoto, Lisa Hamada, D. Nakano, John Smith
2023
View Paper
The State of the Art in Creating Visualization Corpora for Automated Chart Analysis
Chen Chen, Zhicheng Liu
2023
View Paper
Towards accessible chart visualizations for the non-visuals: Research, applications and gaps
Mandhatya Singh, Muhammad Suhaib Kanroo, Hadia Showkat Kawoosa, Puneet Goyal
2023
View Paper
SeeChart: Enabling Accessible Visualizations Through Interactive Natural Language Interface For People with Visual Impairments
Md. Zubair Ibne Alam, Shehnaz Islam, Enamul Hoque
2023
View Paper
Review of chart image detection and classification
Filip Bajić, Josip Job
2023
View Paper
Human Vs. Machine Eye for Chart Interpretation
Prerna Mishra, U. Shrawankar
2022
View Paper
Data Extraction of Circular-Shaped and Grid-like Chart Images
Filip Bajić, Josip Job
2022
View Paper
ChartVi: Charts summarizer for visually impaired
Prerna Mishra, Santosh Kumar, M. K. Chaube, Urmila Shrawankar
2022
View Paper
MDCADNet: Multi dilated & context aggregated dense network for non-textual components classification in digital documents
Mandhatya Singh, Puneet Goyal
2022
View Paper
ChartText: Linking Text with Charts in Documents
J. Pinheiro, Jorge Poco
2022
View Paper
Graph Interpretation, Summarization and Visualization Techniques: A Review and Open Research Issues
P. Mishra, Santosh Kumar, M. K. Chaube
2022
View Paper
Interpreting Audiograms with Multi-stage Neural Networks
Shufan Li, Congxi Lu, Linkai Li, Jirong Duan, Xinping Fu, Haoshuai Zhou
2021
View Paper
VizExtract: Automatic Relation Extraction from Data Visualizations
Dale Decatur, S. Krishnan
2021
View Paper
Graphical integrity issues in open access publications: Detection and patterns of proportional ink violations
Han Zhuang, Tzu-Yang Huang, Daniel Ernesto Acuna
2021
View Paper
CHARTER: heatmap-based multi-type chart data extraction
J. Shtok, Sivan Harary, Ophir Azulai, Adi Raz Goldfarb, Assaf Arbelle, Leonid Karlinsky
2021
View Paper
Parsing AUC Result-Figures in Machine Learning Specific Scholarly Documents for Semantically-enriched Summarization
Iqra Safder, Hafsa Batool, Raheem Sarwar, Farooq Zaman, N. Aljohani, R. Nawaz, Mohamed Gaber, Saeed-Ul Hassan
2021
View Paper
CrowdChart: Crowdsourced Data Extraction From Visualization Charts
Chengliang Chai, Guoliang Li, Ju Fan, Yuyu Luo
2021
View Paper
Evaginating scientific charts: Recovering direct and derived information encodings from chart images
P. Mishra, Santosh Kumar, M. K. Chaube
2021
View Paper
An Approach for Chart Description Generation in Cyber-Physical-Social System
Liang Chen, Kangting Zhao
2021
View Paper
AutoChart: A Dataset for Chart-to-Text Generation Task
Jiawen Zhu, Jinye Ran, R. Lee, Kenny Choo, Zhi Li
2021
View Paper
Auditory Graphs from Denoising Real Images Using Fully Symmetric Convolutional Neural Networks
R. Cádiz, Lothar Droppelmann, Max Guzmán, C. Tejos
2021
View Paper
Towards an efficient framework for Data Extraction from Chart Images
Weihong Ma, Hesuo Zhang, Shuang Yan, Guang Yao, Yichao Huang, Hui Li, Yaqiang Wu, Lianwen Jin
2021
View Paper
Dual Reinforcement-Based Specification Generation for Image De-Rendering
Ramakanth Pasunuru, David B. Rosenberg, Gideon Mann, Mohit Bansal
2021
View Paper
Chartem: Reviving Chart Images with Data Embedding
Jiayun Fu, B. Zhu, Weiwei Cui, Song Ge, Yun Wang, Haidong Zhang, He Huang, Yuanyuan Tang, Dongmei Zhang, Xiaojing Ma
2020
View Paper
STL-CQA: Structure-based Transformers with Localization and Encoding for Chart Question Answering
Hrituraj Singh, Sumit Shekhar
2020
View Paper
Tensor Fields for Data Extraction from Chart Images: Bar Charts and Scatter Plots
Jaya Sreevalsan-Nair, Komal Dadhich, Siri Chandana Daggubati
2020
View Paper
Reverse-engineering bar charts using neural networks
Fangfang Zhou, Yong Zhao, Wenjiang Chen, Yijing Tan, Yaqi Xu, Yi Chen, Chao Liu, Ying Zhao
2020
View Paper
MobileVisFixer: Tailoring Web Visualizations for Mobile Phones Leveraging an Explainable Reinforcement Learning Framework
Aoyu Wu, Wai-Shun Tong, Tim Dwyer, Bongshin Lee, Petra Isenberg, Huamin Qu
2020
View Paper
Figure Captioning in Scholarly Literatures to Augment Search Results
Jingya Yang, Dongdong Zhang, Gaocai Dong, Jing Peng
2020
View Paper
Chart Mining: A Survey of Methods for Automated Chart Analysis
Kenny Davila, Srirangaraj Setlur, D. Doermann, Urala Kota Bhargava, V. Govindaraju
2020
View Paper
Data Visualization Classification Using Simple Convolutional Neural Network Model
Filip Bajić, Josip Job, K. Nenadić
2020
View Paper
Towards a Flexible System Architecture for Automated Knowledge Base Construction Frameworks
O. Din
2019
View Paper
PlotQA: Reasoning over Scientific Plots
Nitesh Methani, Pritha Ganguly, Mitesh M. Khapra, Pratyush Kumar
2019
View Paper
Data Interpretation over Plots
Nitesh Methani, Pritha Ganguly, Mitesh M. Khapra, Pratyush Kumar
2019
View Paper
Challenges in End-to-End Neural Scientific Table Recognition
Yuntian Deng, David S. Rosenberg, Gideon Mann
2019
View Paper
Answering Questions about Data Visualizations using Efficient Bimodal Fusion
Kushal Kafle, Robik Shrestha, Brian L. Price, Scott D. Cohen, Christopher Kanan
2019
View Paper
LEAF-QA: Locate, Encode & Attend for Figure Question Answering
Ritwick Chaudhry, Sumit Shekhar, Utkarsh Gupta, Pranav Maneriker, Prann Bansal, Ajay Joshi
2019
View Paper
Searching the Visual Style and Structure of D3 Visualizations
Enamul Hoque, Maneesh Agrawala
2019
View Paper
Data Extraction from Charts via Single Deep Neural Network
Xiaoyi Liu, D. Klabjan, Patrick N. Bless
2019
View Paper
Visualizing for the Non‐Visual: Enabling the Visually Impaired to Use Visualization
Jinho Choi, Sanghun Jung, Deok Gun Park, J. Choo, N. Elmqvist
2019
View Paper
Chart-Text: A Fully Automated Chart Image Descriptor
Abhijit Balaji, Thuvaarakkesh Ramanathan, Venkateshwarlu Sonathi
2018
View Paper
Designing digital constructive visualization tools
G. Méndez
2018
View Paper
Ranking State-of-the-art Papers via Incomplete Tournaments Induced by Citations from Performance Tables
Mayank Singh, Rajdeep Sarkar, Pawan Goyal, Animesh Mukherjee, Soumen Chakrabarti
2018
View Paper
FigureQA: An Annotated Figure Dataset for Visual Reasoning
Samira Ebrahimi Kahou, Adam Atkinson, Vincent Michalski, Ákos Kádár, Adam Trischler, Yoshua Bengio
2017
View Paper
Automatic Chart Understanding: A Review
Ali Mazraeh Farahani, Peyman Adibi, M. Ehsani, H. Hutter, Alireza Darvishy
2023
View Paper
FlowchartQA: The First Large-Scale Benchmark for Reasoning over Flowcharts
Simon Tannert, Marcelo G. Feighelstein, Jasmina Bogojeska, J. Shtok, Assaf Arbelle, Peter W. J. Staar, Anika Schumann, Jonas Kuhn, Leonid Karlinsky
2023
View Paper
On Metavisualization and Properties of Visualization
Jaya Sreevalsan-Nair
2023
View Paper
ACCirO: A System for Analyzing and Digitizing Images of Charts with Circular Objects
Siri Chandana Daggubati, Jaya Sreevalsan-Nair
2022
View Paper
Towards Assisting the Visually Impaired: A Review on Techniques for Decoding the Visual Data From Chart Images
K. C. Shahira, A. Lijiya
2021
View Paper
ScatterPlotAnalyzer: Digitizing Images of Charts Using Tensor-Based Computational Model
Komal Dadhich, Siri Chandana Daggubati, Jaya Sreevalsan-Nair
2021
View Paper
ChartSight: An Automated Scheme for Assisting Visually Impaired in Understanding Scientific Charts
Mandhatya Singh, Puneet Goyal
2021
View Paper
Data Extraction of Charts with Hybrid Deep Learning Model
K. Sviatov, N. Yarushkina, S. Sukhov
2021
View Paper
DeMatch: Towards Understanding the Panel of Chart Documents
Hesuo Zhang, Weihong Ma, Lianwen Jin, Yichao Huang, Kai Ding, Yaqiang Wu
2021
View Paper
Machine learning-based climate time series anomaly detection using convolutional neural networks
Srinivasan, Wang, Bulleid
2020
View Paper
OsmLocator: locating overlapping scatter marks by simulated annealing on clustering-based re-visualization
Yuming Qiu, Aleksandra Pižurica, Qi Ming, Nicolas Nadisic
View Paper
Kyrtos: A methodology for automatic deep analysis of graphic charts with curves in technical documents
M. Alexiou, N. Bourbakis
View Paper

Comments (0)

This website uses cookies to ensure you get the best experience. Learn more