Tensor Fields for Data Extraction from Chart Images: Bar Charts and Scatter Plots
Publication
Metrics
AI Quick Summary
This paper introduces tensor fields as a computational model for extracting data from raster images of bar charts and scatter plots. It proposes a methodology using positive semidefinite second-order tensor fields and tensor voting for effective data extraction, demonstrating its efficacy for these chart types.
Paper Preview
Abstract
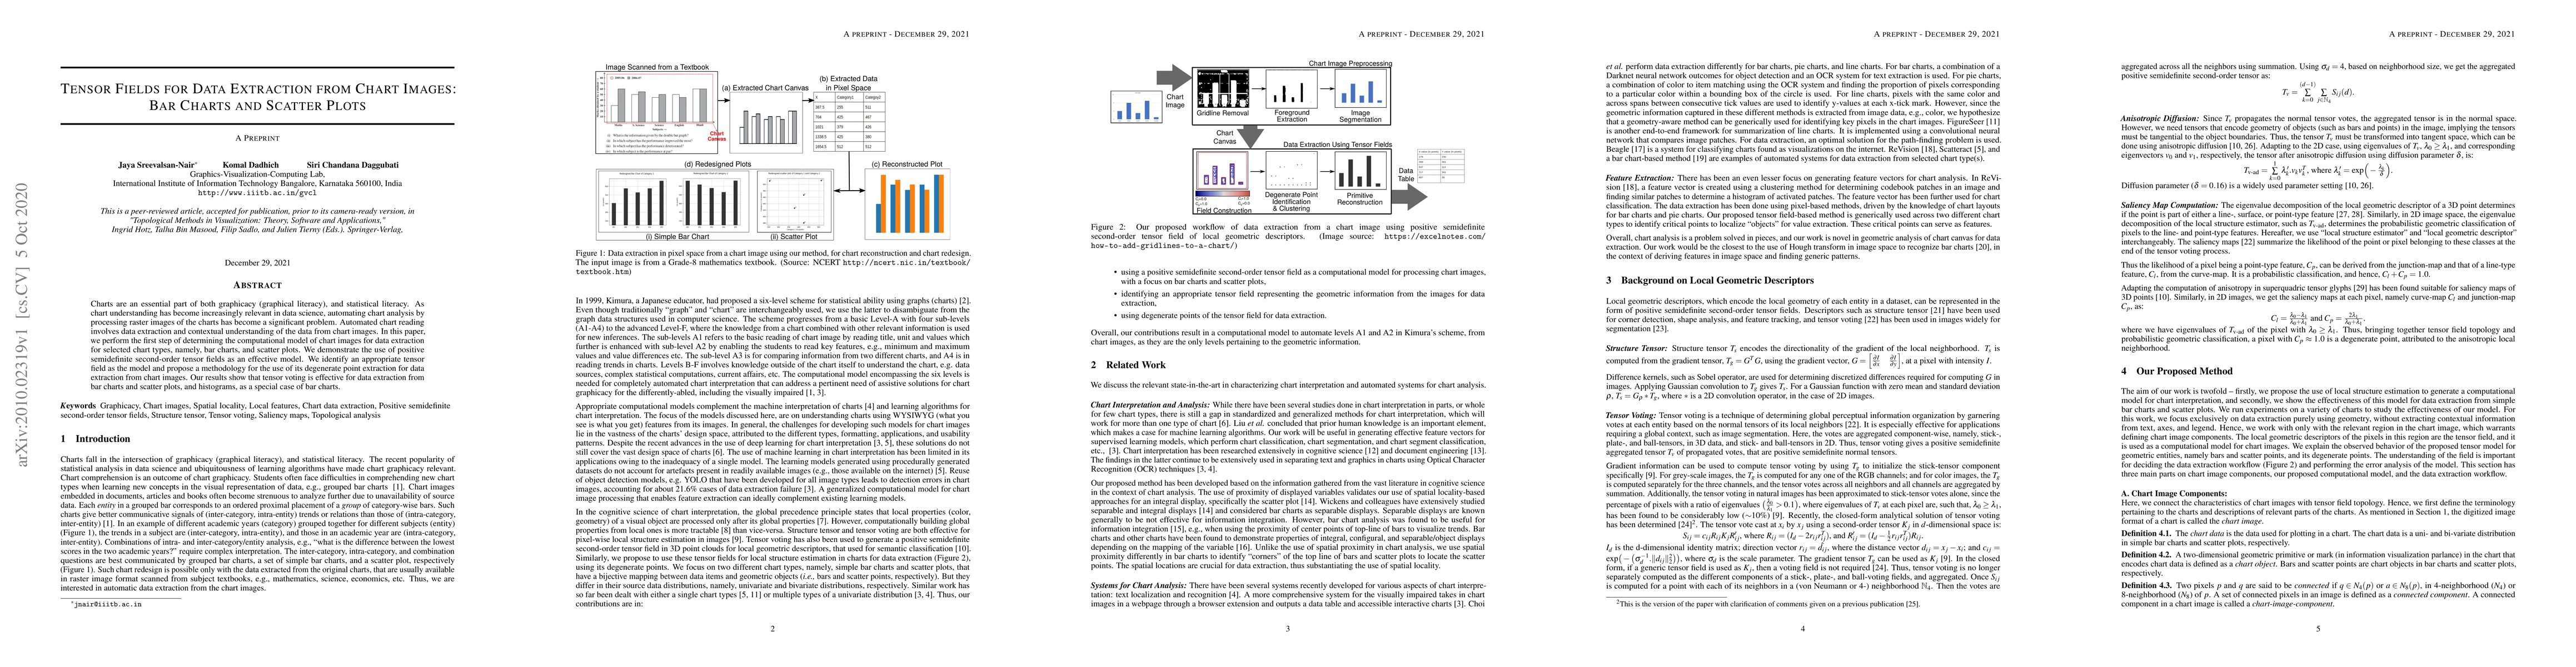
Charts are an essential part of both graphicacy (graphical literacy), and statistical literacy. As chart understanding has become increasingly relevant in data science, automating chart analysis by processing raster images of the charts has become a significant problem. Automated chart reading involves data extraction and contextual understanding of the data from chart images. In this paper, we perform the first step of determining the computational model of chart images for data extraction for selected chart types, namely, bar charts, and scatter plots. We demonstrate the use of positive semidefinite second-order tensor fields as an effective model. We identify an appropriate tensor field as the model and propose a methodology for the use of its degenerate point extraction for data extraction from chart images. Our results show that tensor voting is effective for data extraction from bar charts and scatter plots, and histograms, as a special case of bar charts.
AI Key Findings
Get AI-generated insights about this paper's methodology, results, significance, and more — seven facets brought into focus.
Impact
Paper Details
Authors
PDF Preview
Key Terms
Citation Network
Current paper (gray), citations (green), references (blue)
Display is limited for performance on very large graphs.
Discussion 0