Science overlay maps: a new tool for research policy and library management
Publication
Metrics
AI Quick Summary
This paper introduces science overlay maps as a new tool for visualizing research bodies and tracking temporal changes, aiding in policy and library management. These maps facilitate benchmarking, collaboration exploration, and the investigation of interdisciplinary scientific developments.
Paper Preview
Abstract
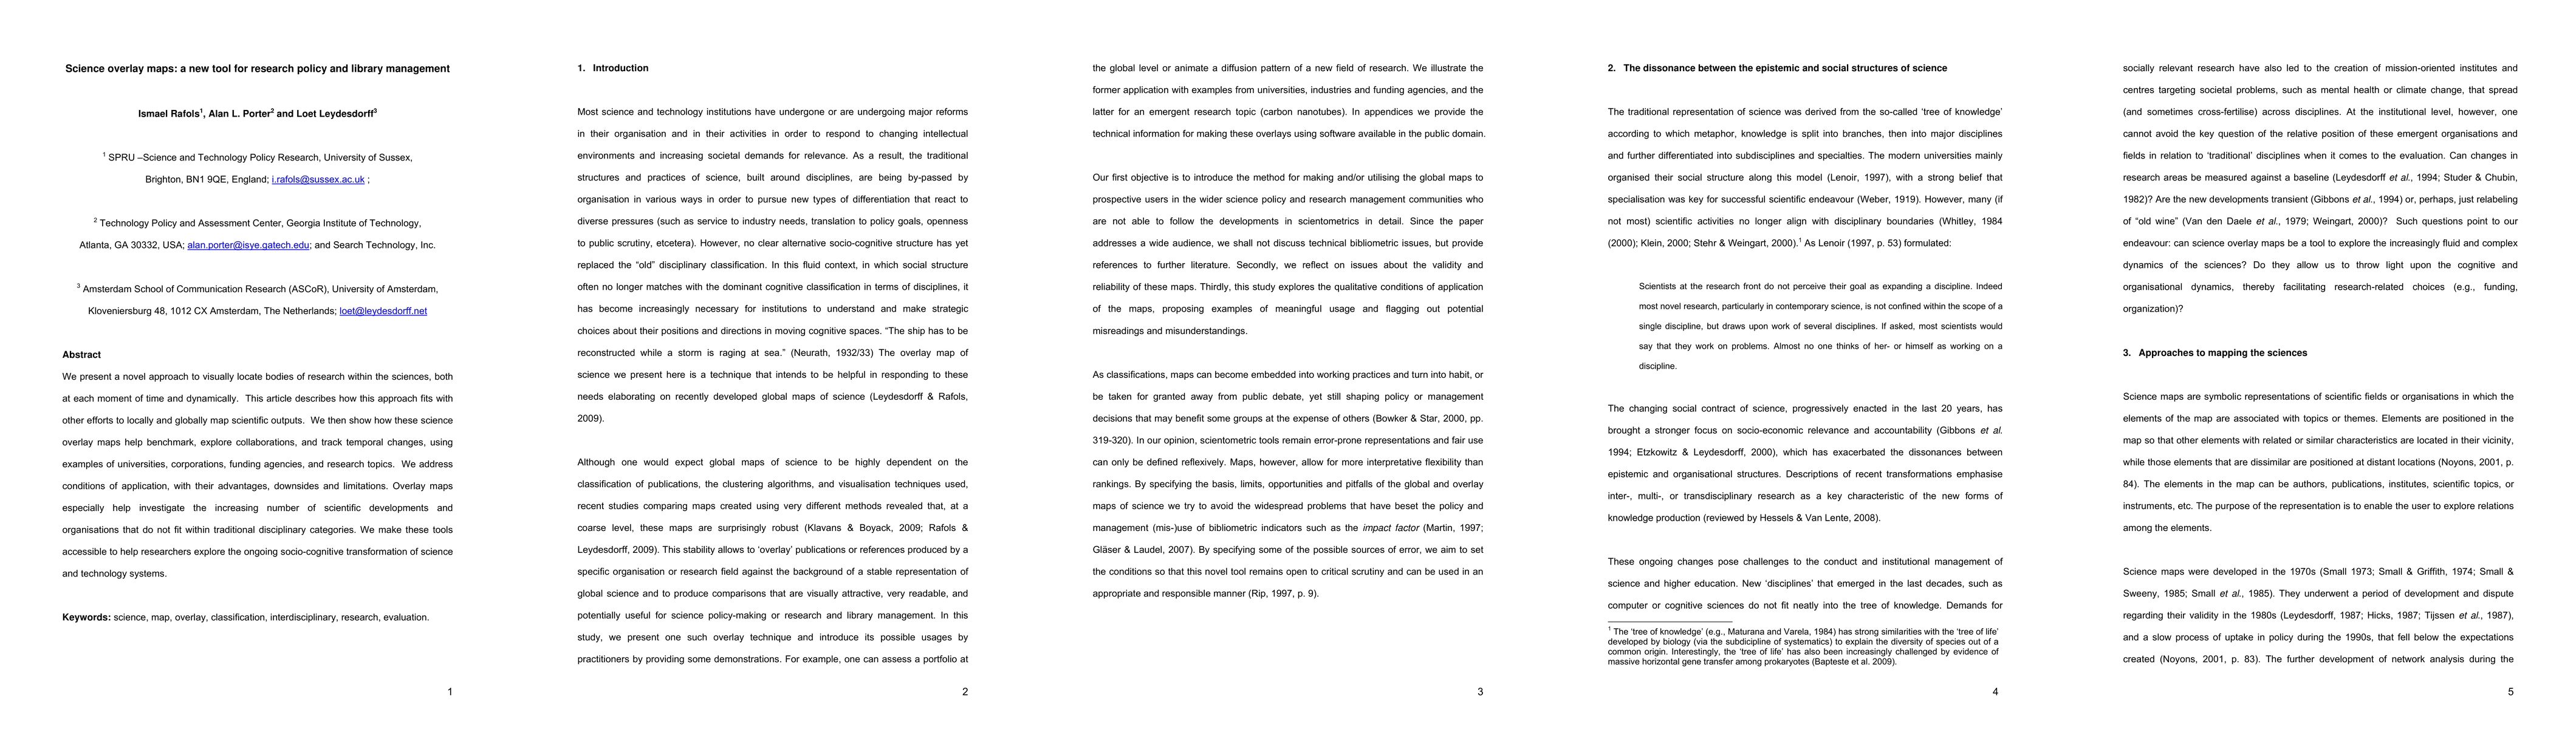
We present a novel approach to visually locate bodies of research within the sciences, both at each moment of time and dynamically. This article describes how this approach fits with other efforts to locally and globally map scientific outputs. We then show how these science overlay maps help benchmark, explore collaborations, and track temporal changes, using examples of universities, corporations, funding agencies, and research topics. We address conditions of application, with their advantages, downsides and limitations. Overlay maps especially help investigate the increasing number of scientific developments and organisations that do not fit within traditional disciplinary categories. We make these tools accessible to help researchers explore the ongoing socio-cognitive transformation of science and technology systems.
AI Key Findings
Get AI-generated insights about this paper's methodology, results, significance, and more — seven facets brought into focus.
Impact
Paper Details
PDF Preview
Key Terms
Citation Network
Current paper (gray), citations (green), references (blue)
Display is limited for performance on very large graphs.
Discussion 0