Authors
Summary
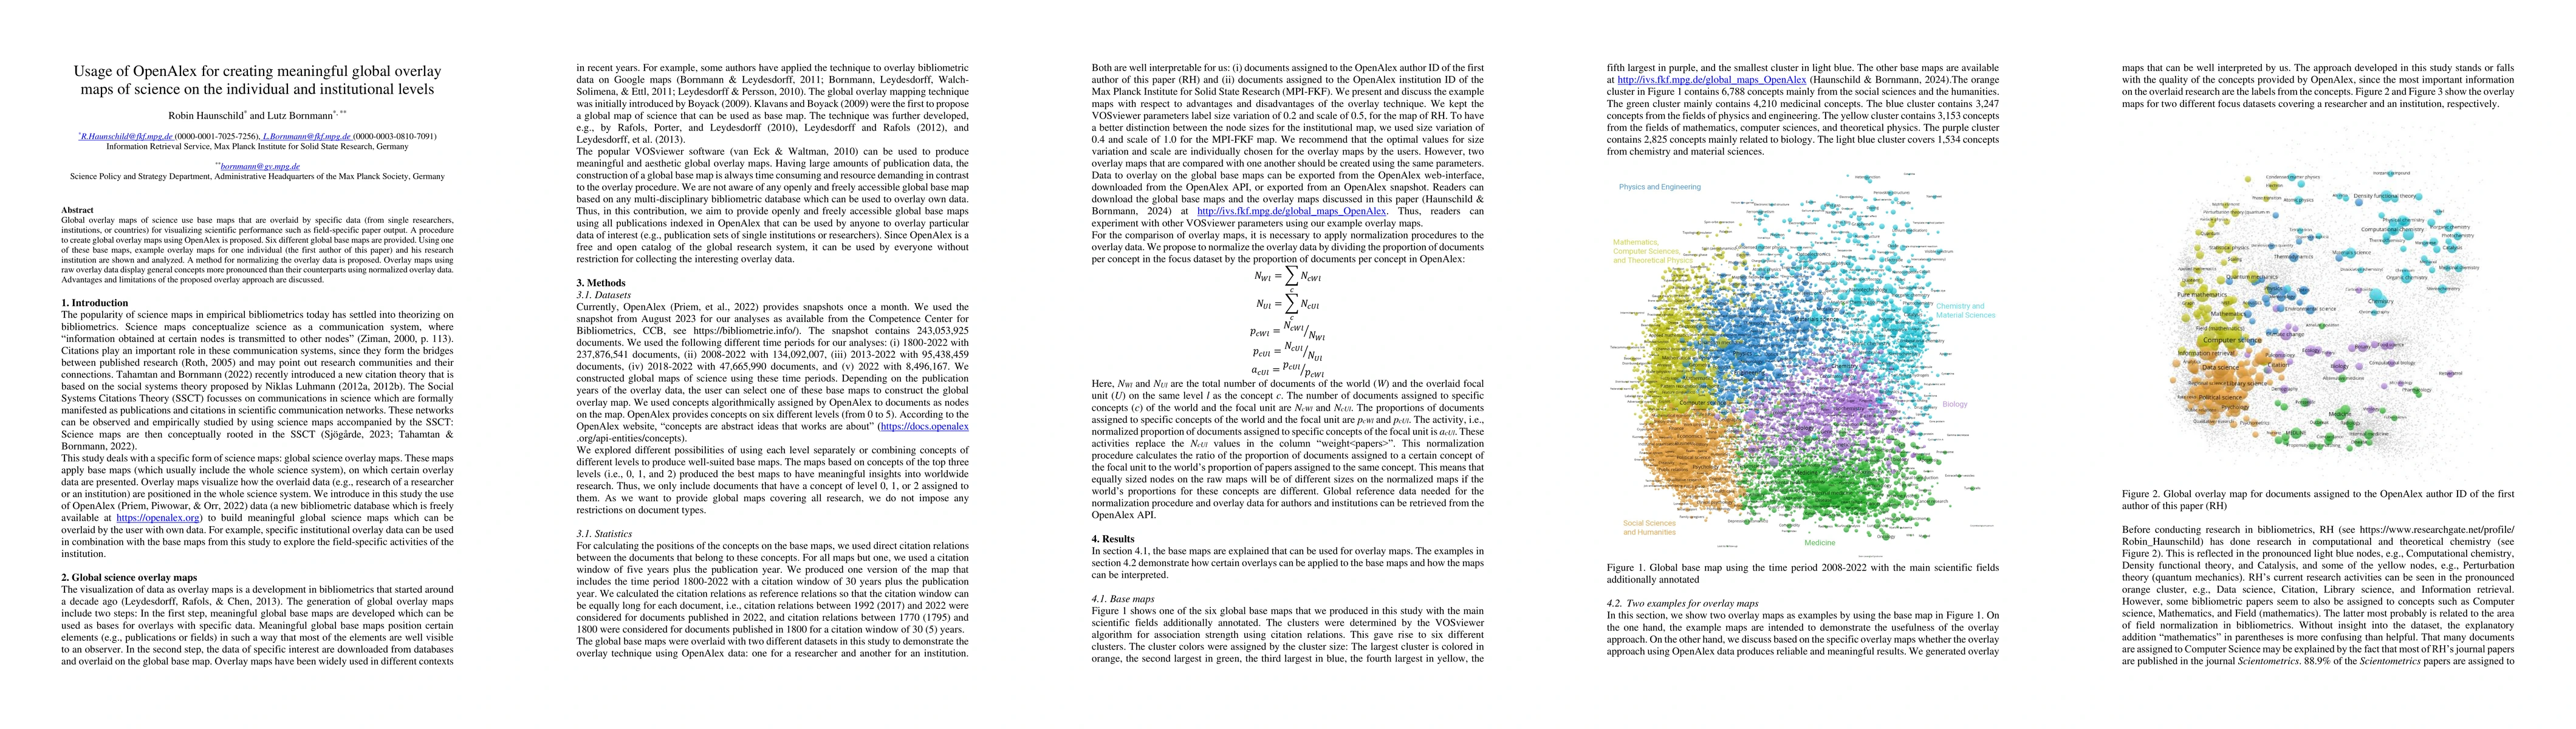
Global overlay maps of science use base maps that are overlaid by specific data (from single researchers, institutions, or countries) for visualizing scientific performance such as field-specific paper output. A procedure to create global overlay maps using OpenAlex is proposed. Six different global base maps are provided. Using one of these base maps, example overlay maps for one individual (the first author of this paper) and his research institution are shown and analyzed. A method for normalizing the overlay data is proposed. Overlay maps using raw overlay data display general concepts more pronounced than their counterparts using normalized overlay data. Advantages and limitations of the proposed overlay approach are discussed.
AI Key Findings
Get AI-generated insights about this paper's methodology, results, and significance.
Paper Details
PDF Preview
Key Terms
Citation Network
Current paper (gray), citations (green), references (blue)
Display is limited for performance on very large graphs.
Similar Papers
Found 4 papersReference Coverage Analysis of OpenAlex compared to Web of Science and Scopus
Nick Haupka, Najko Jahn, Philipp Mayr et al.
Analysis of the Publication and Document Types in OpenAlex, Web of Science, Scopus, Pubmed and Semantic Scholar
Nick Haupka, Jack H. Culbert, Alexander Schniedermann et al.
| Title | Authors | Year | Actions |
|---|
Comments (0)