Summary
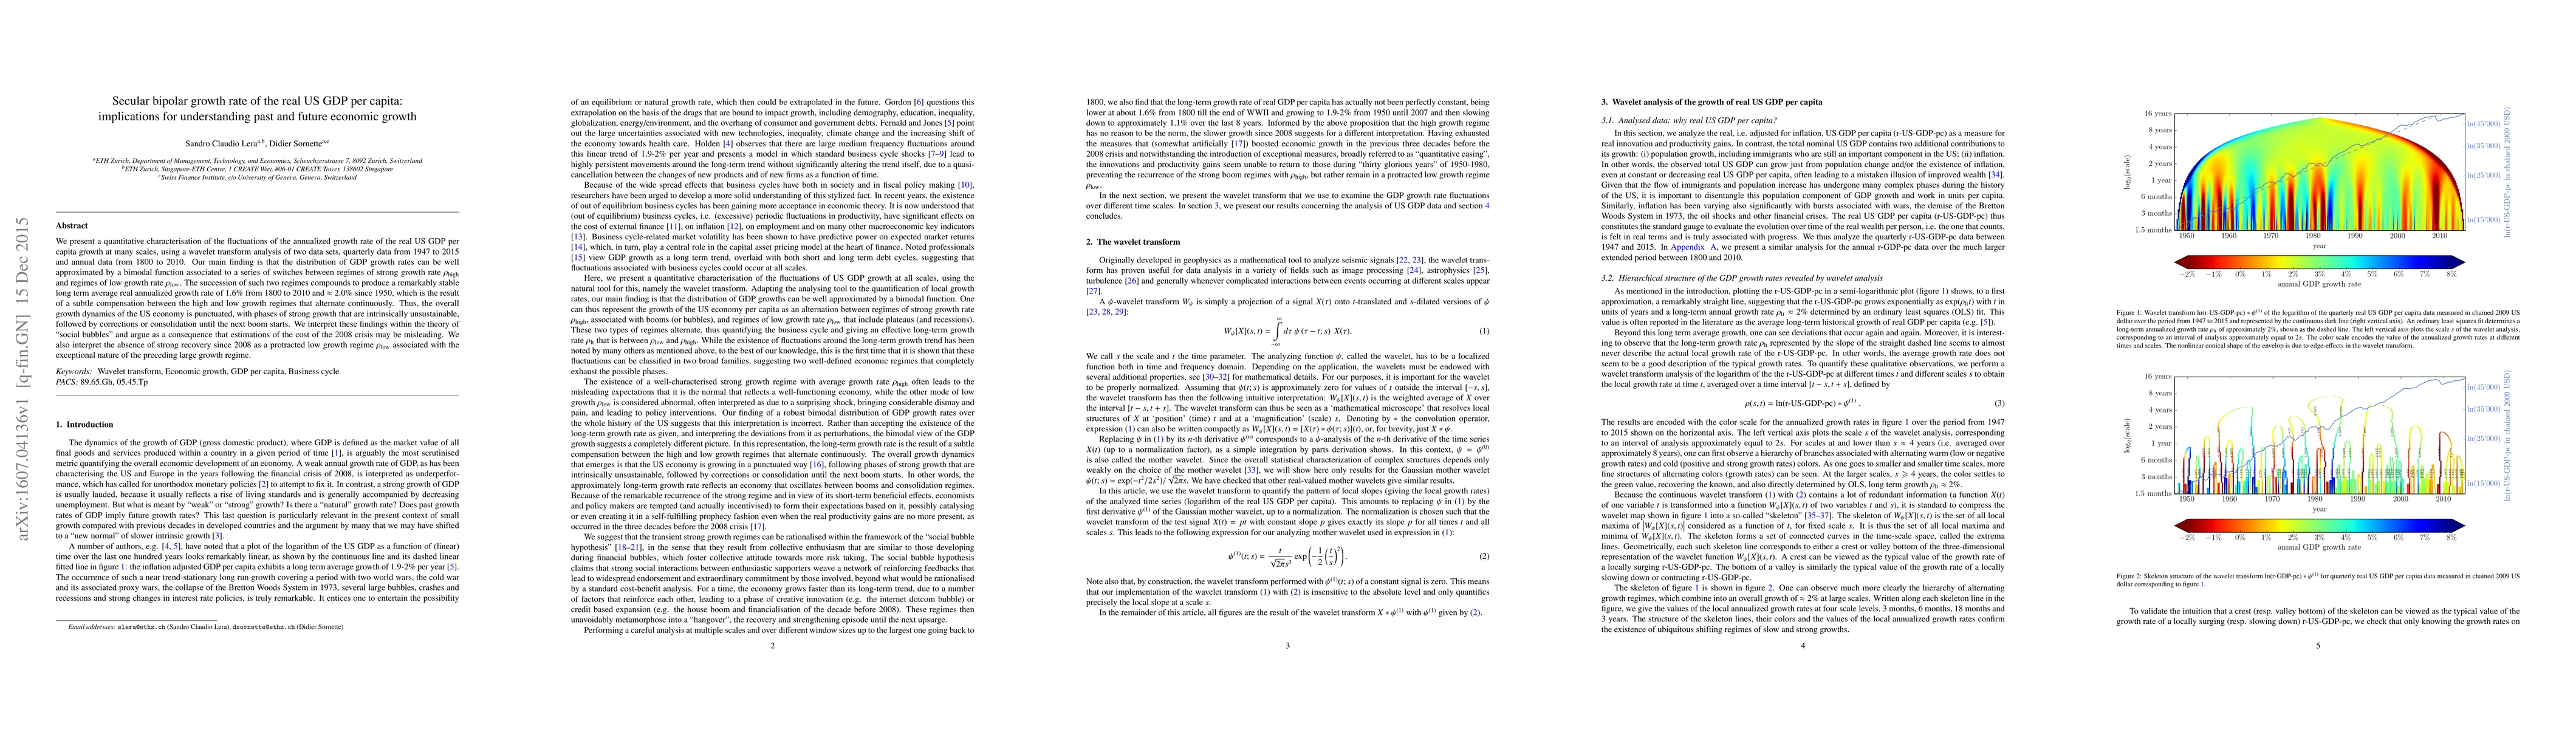
We present a quantitative characterisation of the fluctuations of the annualized growth rate of the real US GDP per capita growth at many scales, using a wavelet transform analysis of two data sets, quarterly data from 1947 to 2015 and annual data from 1800 to 2010. Our main finding is that the distribution of GDP growth rates can be well approximated by a bimodal function associated to a series of switches between regimes of strong growth rate $\rho_\text{high}$ and regimes of low growth rate $\rho_\text{low}$. The succession of such two regimes compounds to produce a remarkably stable long term average real annualized growth rate of 1.6\% from 1800 to 2010 and $\approx 2.0\%$ since 1950, which is the result of a subtle compensation between the high and low growth regimes that alternate continuously. Thus, the overall growth dynamics of the US economy is punctuated, with phases of strong growth that are intrinsically unsustainable, followed by corrections or consolidation until the next boom starts. We interpret these findings within the theory of "social bubbles" and argue as a consequence that estimations of the cost of the 2008 crisis may be misleading. We also interpret the absence of strong recovery since 2008 as a protracted low growth regime $\rho_\text{low}$ associated with the exceptional nature of the preceding large growth regime.
AI Key Findings
Get AI-generated insights about this paper's methodology, results, and significance.
Paper Details
PDF Preview
Key Terms
Citation Network
Current paper (gray), citations (green), references (blue)
Display is limited for performance on very large graphs.
Similar Papers
Found 4 papers| Title | Authors | Year | Actions |
|---|
Comments (0)