ArxivLens

Publication

Published: Feb 25, 2026
Categories: cs.HC

Metrics

Source: ArXiv

Quick Answers

What methodology did the authors use?

Three experiments were conducted: (1) 32 participants performed relative similarity judgments on 1,881 node-link diagrams; (2) 16 computational graph-similarity measures were benchmarked against the human data; (3) three state-of-the-art multimodal large language models (GPT‑5, Gemini 2.5 Pro, Claude Sonnet 4.5) were evaluated on the same task using structured prompts and their agreement and confidence were compared to humans. More in Methodology →

What are the key results?

Human participants reliably judged graph similarity, with global shape and edge density driving decisions and an overall accuracy of 77.2 % (p<.001). — Portrait divergence emerged as the best-performing computational metric (κ≈0.42), but its agreement with human judgments remained moderate and varied with graph size and layout. More in Key Results →

Why is this work significant?

The study establishes a comprehensive benchmark linking human perception, traditional metrics, and MLLMs for graph similarity, demonstrating that MLLMs can serve as explainable, high‑accuracy proxies and guiding the design of visual analytics systems that align with analyst intuition. More in Significance →

What are the main limitations?

The human sample was limited to 32 university‑educated adults, potentially restricting generalizability. — The MLLM evaluation used only three models and static image prompts, omitting dynamic or node‑correspondence scenarios. More in Limitations →

Paper Preview

Abstract

Comparing graphs to identify similarities is a fundamental task in visual analytics of graph data. To support this, visual analytics systems frequently employ quantitative computational measures to provide automated guidance. However, it remains unclear how well these measures align with subjective human visual perception, thereby offering recommendations that conflict with analysts' intuitive judgments, potentially leading to confusion rather than reducing cognitive load. Multimodal Large Language Models (MLLMs), capable of visually interpreting graphs and explaining their reasoning in natural language, have emerged as a potential alternative to address this challenge. This paper bridges the gap between human and machine assessment of graph similarity through three interconnected experiments using a dataset of 1,881 node-link diagrams. Experiment 1 collects relative similarity judgments and rationales from 32 human participants, revealing consensus on graph similarity while prioritizing global shapes and edge densities over exact topological details. Experiment 2 benchmarks 16 computational measures against these human judgments, identifying Portrait divergence as the best-performing metric, though with only moderate alignment. Experiment 3 evaluates the potential of three state-of-the-art MLLMs (GPT-5, Gemini 2.5 Pro, Claude Sonnet 4.5) as perceptual proxies. The results demonstrate that MLLMs, particularly GPT-5, significantly outperform traditional measures in aligning with human graph similarity perception and provide interpretable rationales for their decisions, whereas Claude Sonnet 4.5 shows the best computational efficiency. Our findings suggest that MLLMs hold significant promise not only as effective, explainable proxies for human perception but also as intelligent guides that can uncover subtle nuances that might be overlooked by human analysts in visual analytics systems.
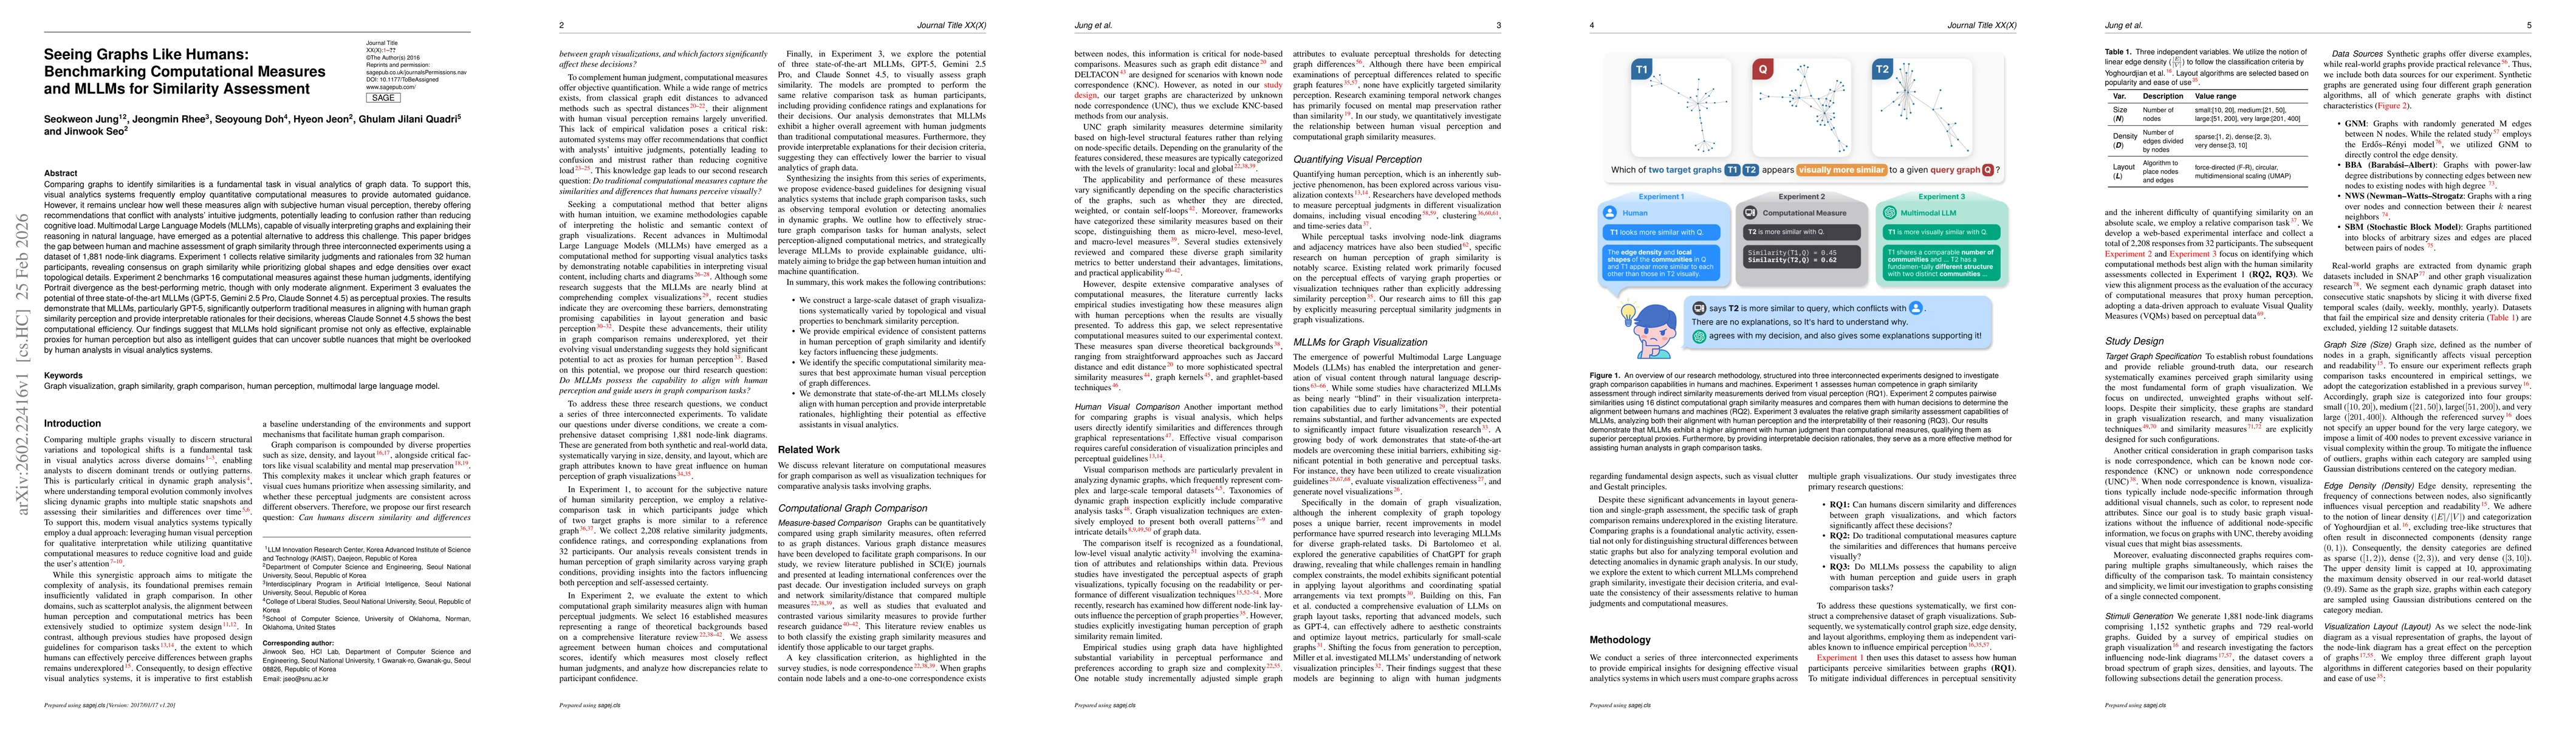
Key Findings, in focus

Seven facets of this paper, analysed and brought into focus by AI.

AI-generated · verify against source Generated Feb 27, 2026
In focus · one-line synthesis

The study establishes a comprehensive benchmark linking human perception, traditional metrics, and MLLMs for graph similarity, demonstrating that MLLMs can serve as explainable, high‑accuracy proxies and guiding the design of visual analytics systems that align with analyst intuition.

01
MethodologyHow they did it

Three experiments were conducted: (1) 32 participants performed relative similarity judgments on 1,881 node-link diagrams; (2) 16 computational graph-similarity measures were benchmarked against the human data; (3) three state-of-the-art multimodal large language models (GPT‑5, Gemini 2.5 Pro, Claude Sonnet 4.5) were evaluated on the same task using structured prompts and their agreement and confidence were compared to humans.

02
ResultsWhat they found
  • Human participants reliably judged graph similarity, with global shape and edge density driving decisions and an overall accuracy of 77.2 % (p<.001).
  • Portrait divergence emerged as the best-performing computational metric (κ≈0.42), but its agreement with human judgments remained moderate and varied with graph size and layout.
  • GPT‑5 achieved the highest agreement with humans (κ≈0.48) and the strongest correlation with human confidence (ρ≈0.35), outperforming Portrait divergence; Gemini was faster but less confident, and Claude offered the lowest latency with comparable accuracy.
03
SignificanceWhy it matters

The study establishes a comprehensive benchmark linking human perception, traditional metrics, and MLLMs for graph similarity, demonstrating that MLLMs can serve as explainable, high‑accuracy proxies and guiding the design of visual analytics systems that align with analyst intuition.

04
Technical ContributionsWhat's new technically

A systematic framework for benchmarking human, computational, and multimodal language model assessments of graph similarity, including the identification of Portrait divergence as the leading metric and the demonstration of MLLMs’ superior alignment and explainability.

05
NoveltyWhat sets it apart

First study to directly compare human perception, traditional graph‑similarity metrics, and state‑of‑the‑art MLLMs on a large dataset, revealing that MLLMs can outperform conventional measures while providing interpretable rationales.

06
LimitationsWhat to be cautious about
  • The human sample was limited to 32 university‑educated adults, potentially restricting generalizability.
  • The MLLM evaluation used only three models and static image prompts, omitting dynamic or node‑correspondence scenarios.
07
Future WorkWhere it goes next
  • Expand the participant pool and include dynamic, time‑varying graphs to test generalizability.
  • Integrate MLLMs into interactive visual analytics workflows and evaluate real‑world analyst performance and trust.

Paper Details

Paper ID: 2602.22416
Comments: 21 pages including 1 page of appendix, 9 figures, 4 tables
Categories:
cs.HC

How to Cite This Paper

Reference manager: RIS EndNote


Discussion 0

This website uses cookies to ensure you get the best experience. Learn more