SightBi: Exploring Cross-View Data Relationships with Biclusters
Publication
Metrics
AI Quick Summary
This paper introduces SightBi, a visual analytics approach that helps users explore cross-view data relationships using biclusters. It aims to reduce user effort in trial-and-error tasks and provide an overview of relationships to guide exploration.
Paper Preview
Abstract
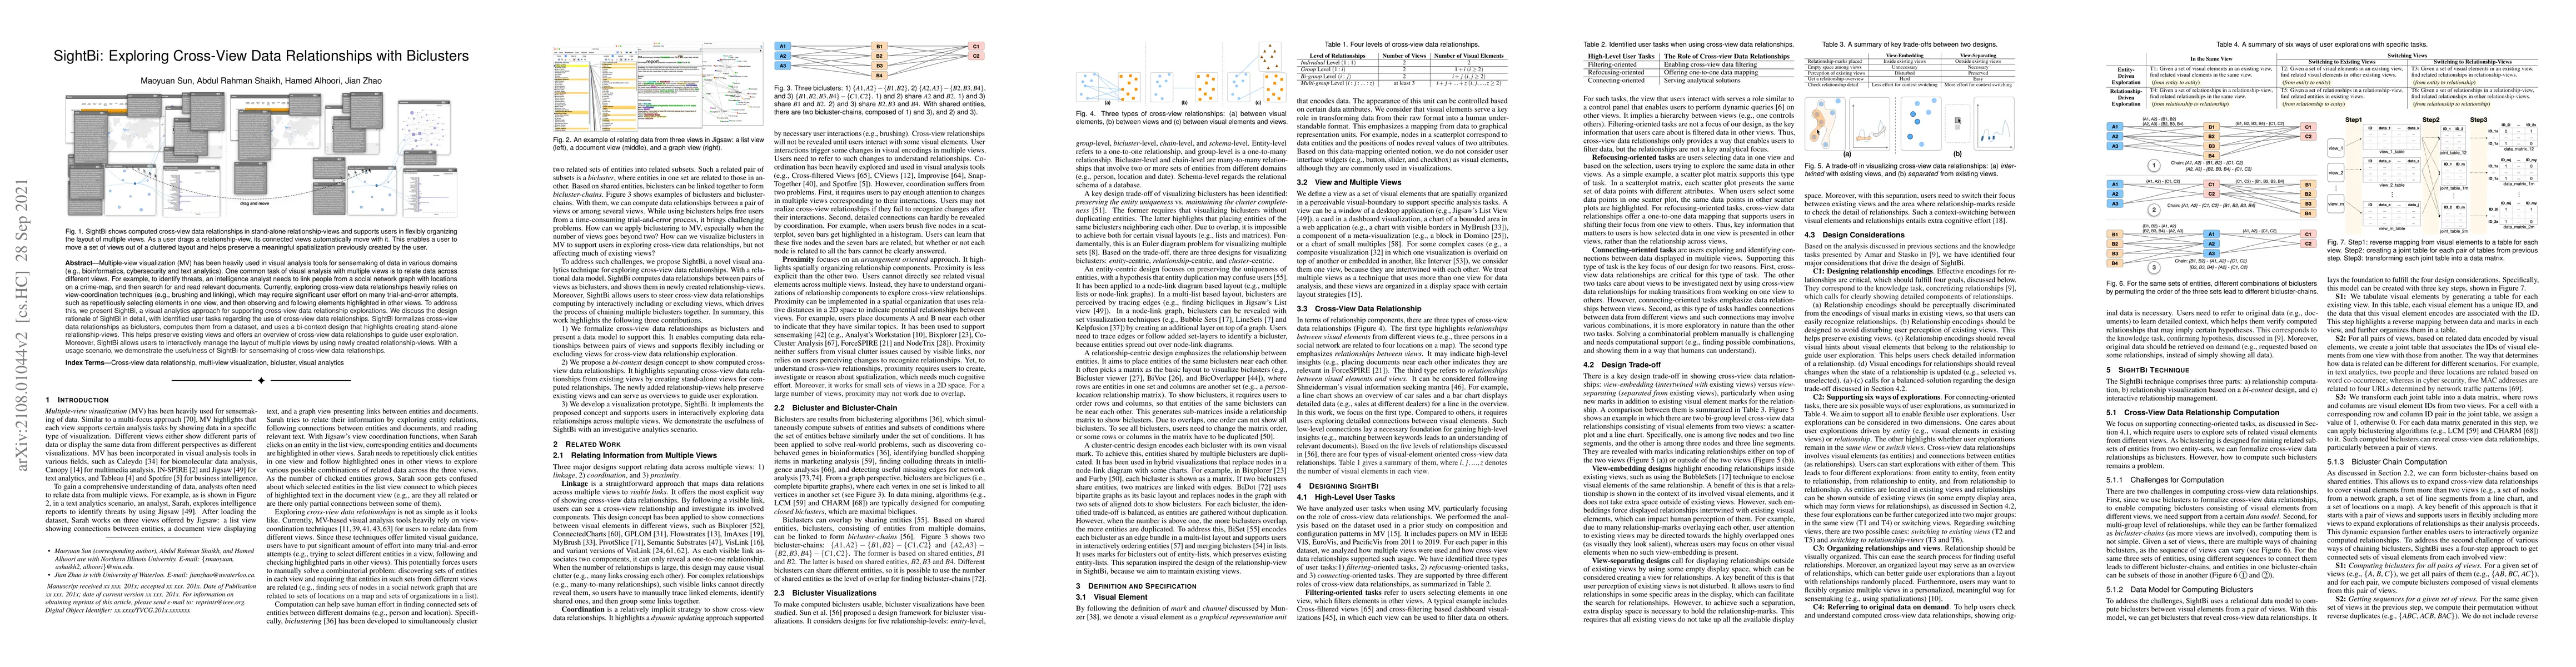
Multiple-view visualization (MV) has been heavily used in visual analysis tools for sensemaking of data in various domains (e.g., bioinformatics, cybersecurity and text analytics). One common task of visual analysis with multiple views is to relate data across different views. For example, to identify threats, an intelligence analyst needs to link people from a social network graph with locations on a crime-map, and then search for and read relevant documents. Currently, exploring cross-view data relationships heavily relies on view-coordination techniques (e.g., brushing and linking), which may require significant user effort on many trial-and-error attempts, such as repetitiously selecting elements in one view, and then observing and following elements highlighted in other views. To address this, we present SightBi, a visual analytics approach for supporting cross-view data relationship explorations. We discuss the design rationale of SightBi in detail, with identified user tasks regarding the use of cross-view data relationships. SightBi formalizes cross-view data relationships as biclusters, computes them from a dataset, and uses a bi-context design that highlights creating stand-alone relationship-views. This helps preserve existing views and offers an overview of cross-view data relationships to guide user exploration. Moreover, SightBi allows users to interactively manage the layout of multiple views by using newly created relationship-views. With a usage scenario, we demonstrate the usefulness of SightBi for sensemaking of cross-view data relationships.
AI Key Findings
Get AI-generated insights about this paper's methodology, results, significance, and more — seven facets brought into focus.
Impact
Paper Details
Authors
PDF Preview
Key Terms
Citation Network
Current paper (gray), citations (green), references (blue)
Display is limited for performance on very large graphs.
Discussion 0