A functional time series approach is proposed for investigating spatial
correlation in daily maximum temperature forecast errors for 111 cities spread
across the U.S. The modelling of spatial correlation is most fruitful for
longer forecast horizons, and becomes less relevant as the forecast horizon
shrinks towards zero. For 6-day-ahead forecasts, the functional approach
uncovers interpretable regional spatial effects, and captures the higher
variance observed in inland cities versus coastal cities, as well as the higher
variance observed in mountain and midwest states. The functional approach also
naturally handles missing data through modelling a continuum, and can be
implemented efficiently by exploiting the sparsity induced by a B-spline basis.
The temporal dependence in the data is modeled through temporal dependence in
functional basis coefficients. Independent first order autoregressions with
generalized autoregressive conditional heteroskedasticity [AR(1)+GARCH(1,1)]
and Student-t innovations work well to capture the persistence of basis
coefficients over time and the seasonal heteroskedasticity reflecting higher
variance in winter. Through exploiting autocorrelation in the basis
coefficients, the functional time series approach also yields a method for
improving weather forecasts and uncertainty quantification. The resulting
method corrects for bias in the weather forecasts, while reducing the error
variance.
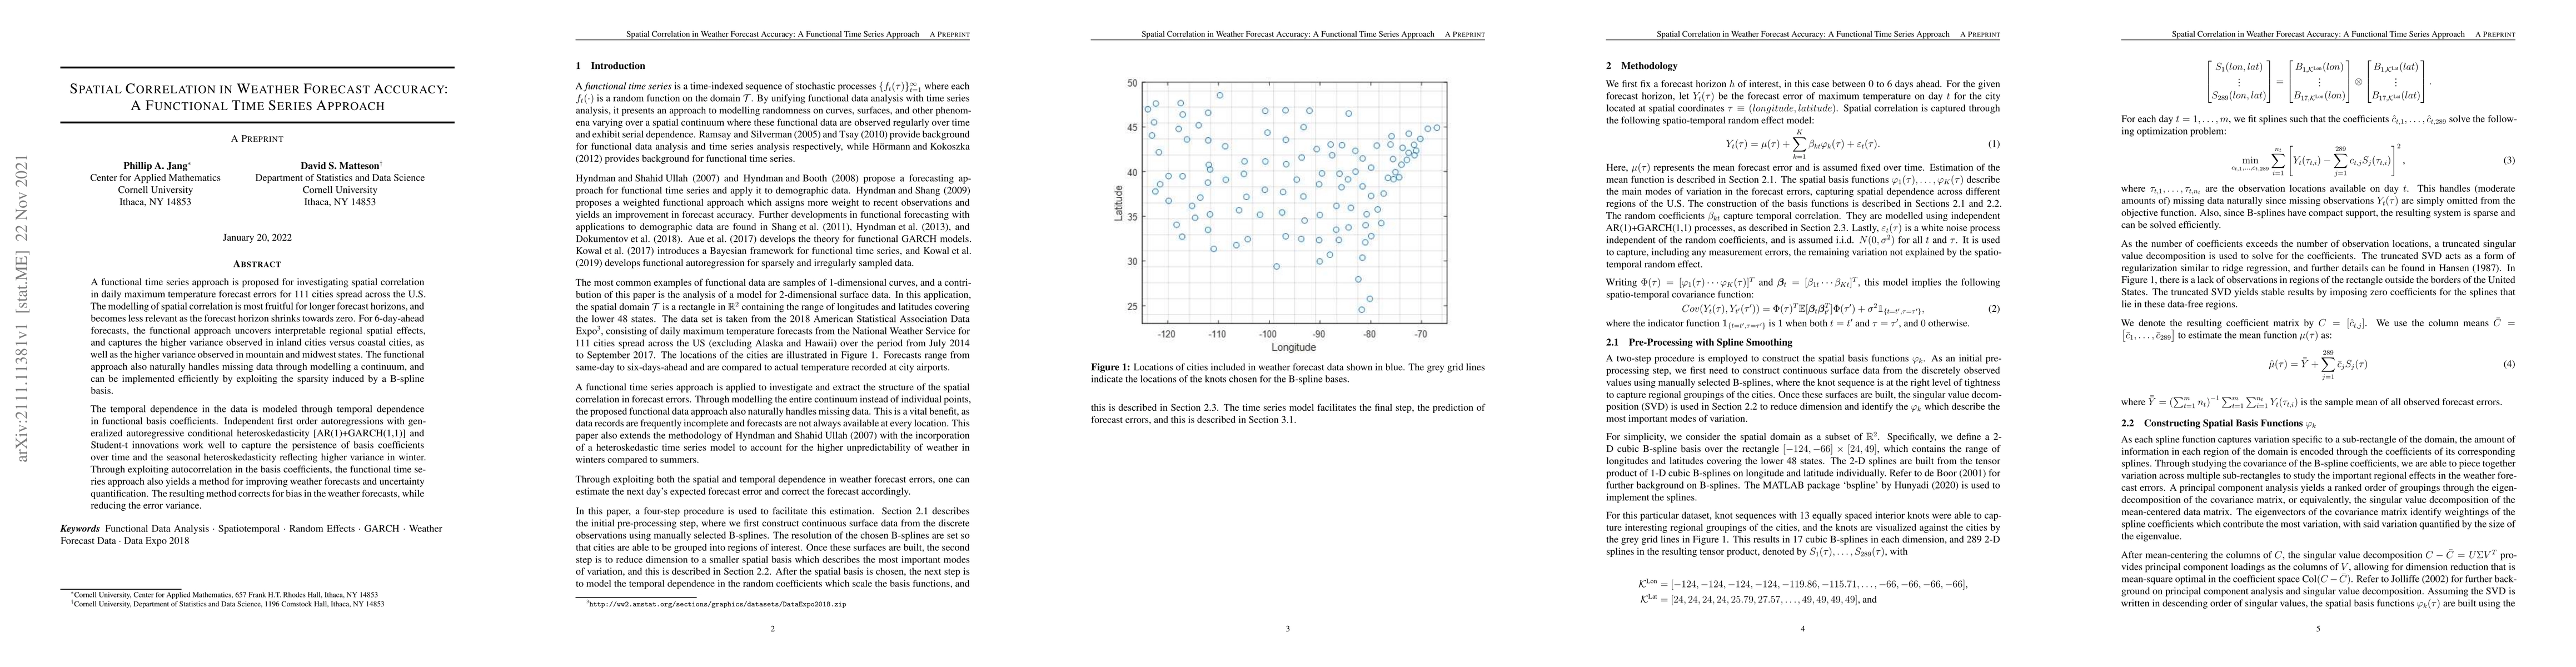
Discussion 0