Publication
Metrics
Paper Preview
Abstract
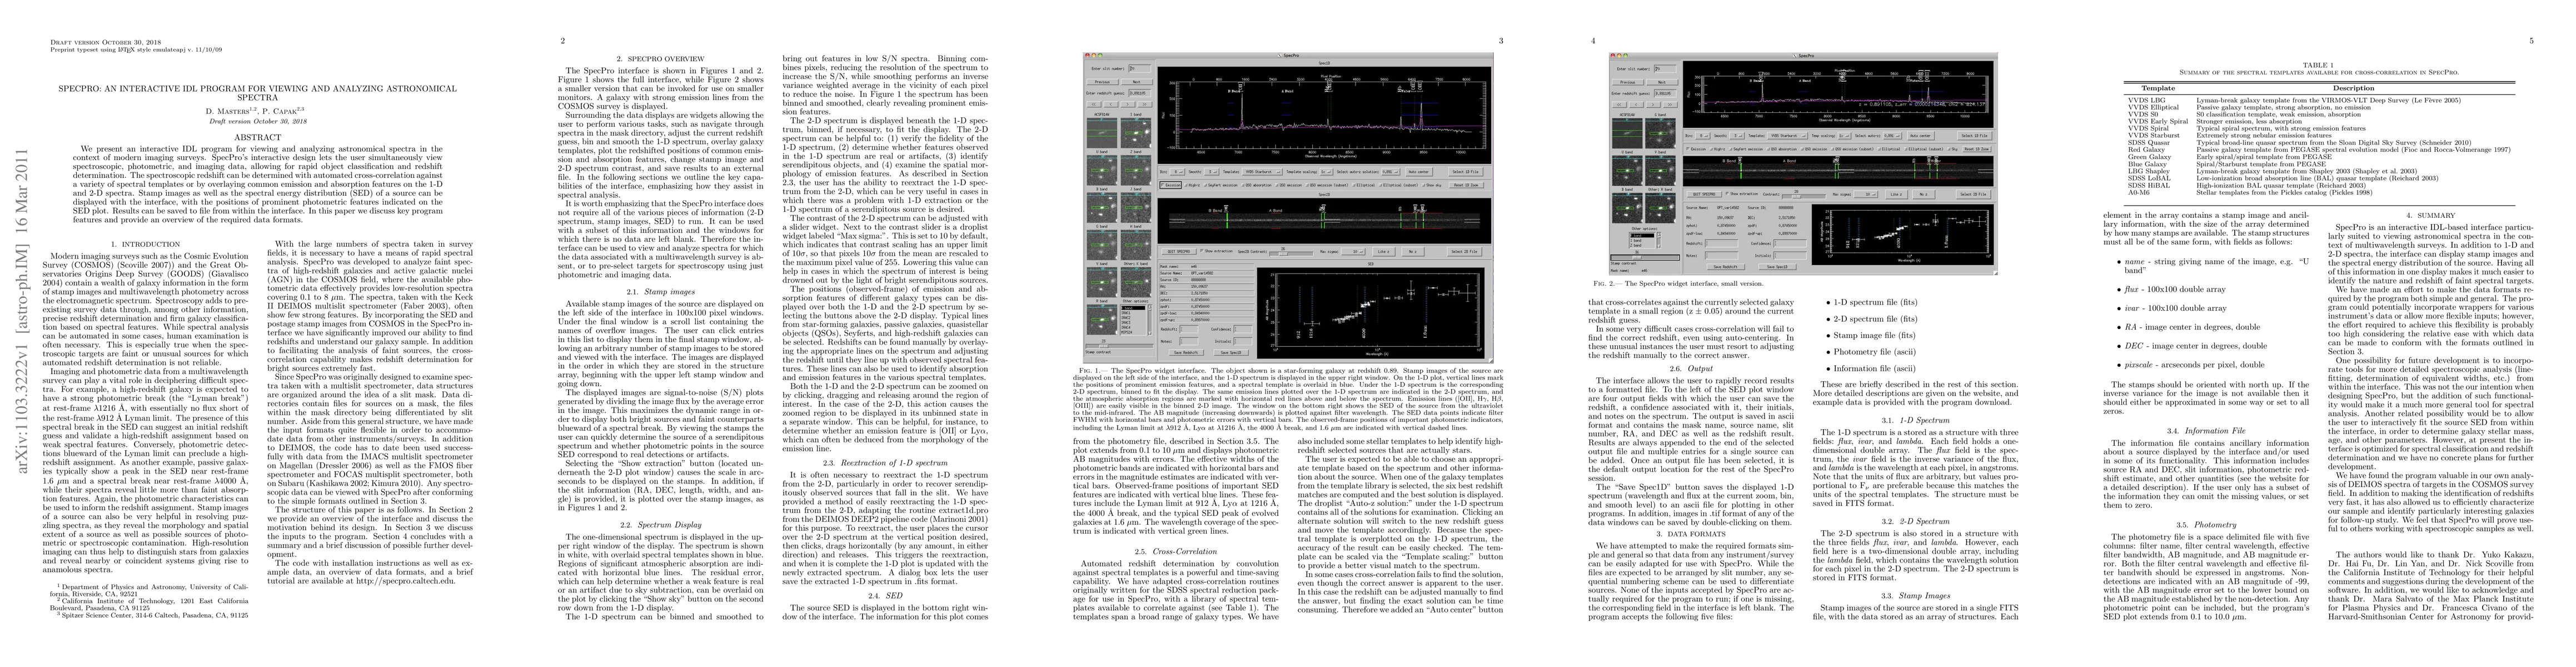
We present an interactive IDL program for viewing and analyzing astronomical spectra in the context of modern imaging surveys. SpecPro's interactive design lets the user simultaneously view spectroscopic, photometric, and imaging data, allowing for rapid object classification and redshift determination. The spectroscopic redshift can be determined with automated cross-correlation against a variety of spectral templates or by overlaying common emission and absorption features on the 1-D and 2-D spectra. Stamp images as well as the spectral energy distribution (SED) of a source can be displayed with the interface, with the positions of prominent photometric features indicated on the SED plot. Results can be saved to file from within the interface. In this paper we discuss key program features and provide an overview of the required data formats.
AI Key Findings
Get AI-generated insights about this paper's methodology, results, significance, and more — seven facets brought into focus.
Impact
Paper Details
PDF Preview
Key Terms
Citation Network
Current paper (gray), citations (green), references (blue)
Display is limited for performance on very large graphs.
Discussion 0