Spectral Processing of COVID-19 Time-Series Data
Publication
Metrics
Paper Preview
Abstract
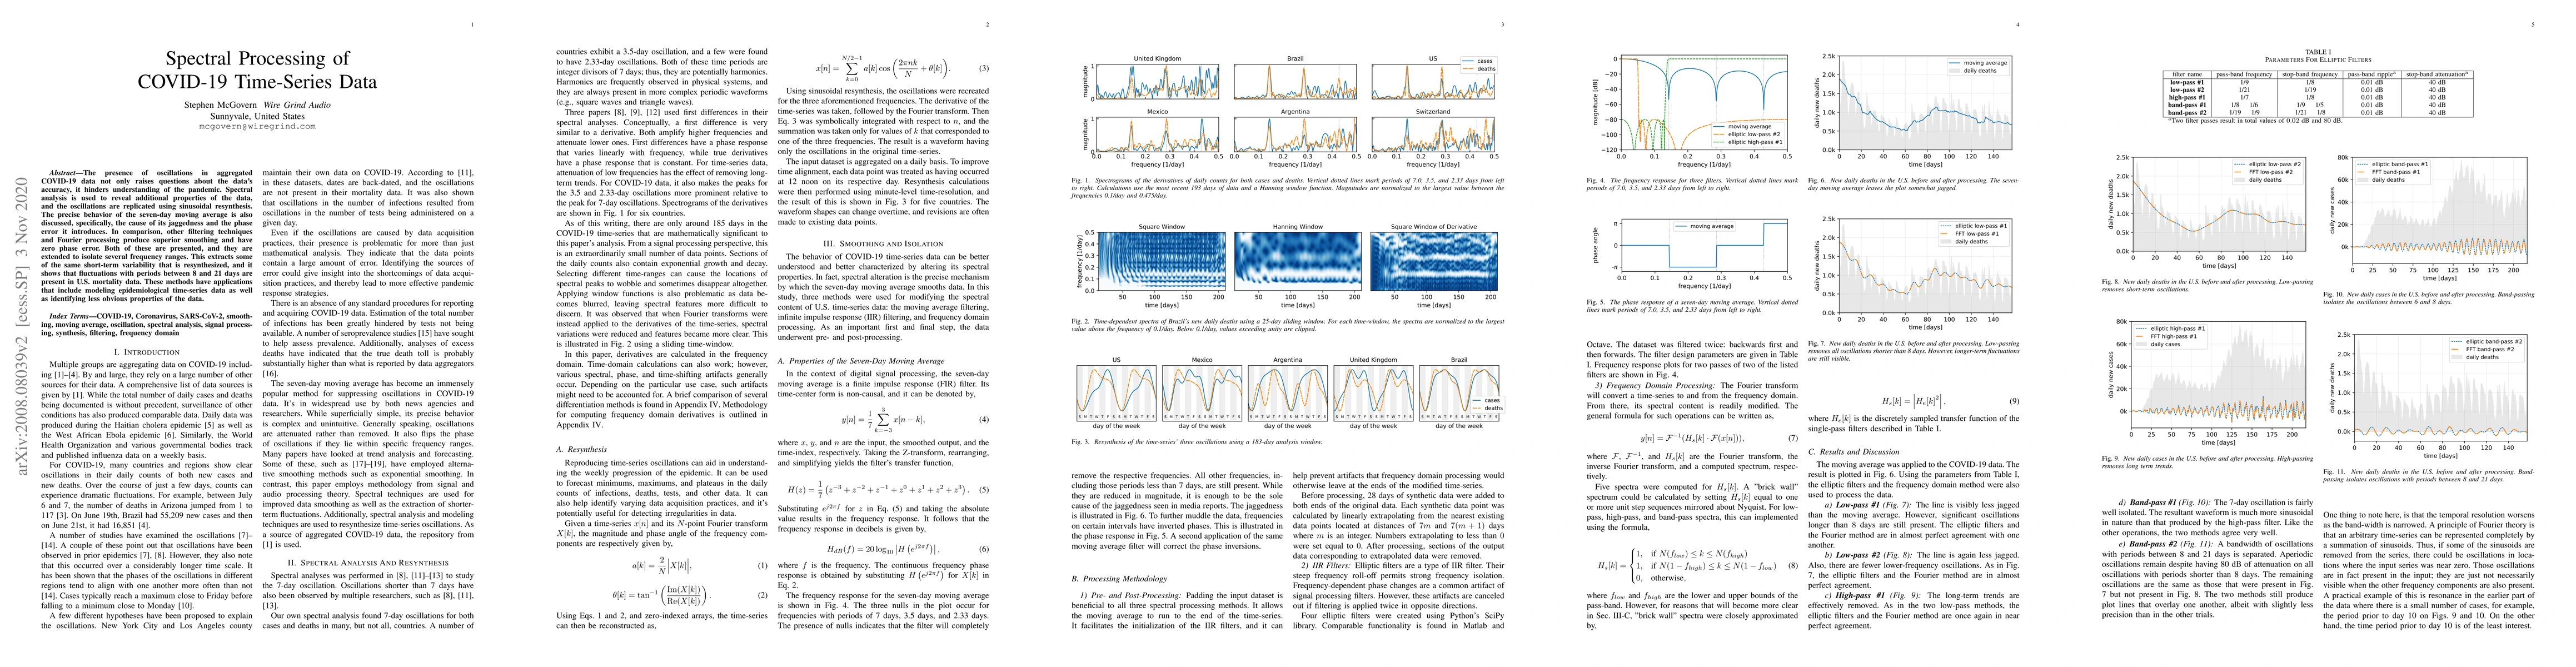
The presence of oscillations in aggregated COVID-19 data not only raises questions about the data's accuracy, it hinders understanding of the pandemic. Spectral analysis is used to reveal additional properties of the data, and the oscillations are replicated using sinusoidal resynthesis. The precise behavior of the seven-day moving average is also discussed, specifically, the cause of its jaggedness and the phase error it introduces. In comparison, other filtering techniques and Fourier processing produce superior smoothing and have zero phase error. Both of these are presented, and they are extended to isolate several frequency ranges. This extracts some of the same short-term variability that is resynthesized, and it shows that fluctuations with periods between 8 and 21 days are present in U.S. mortality data. These methods have applications that include modeling epidemiological time-series data as well as identifying less obvious properties of the data.
AI Key Findings
Get AI-generated insights about this paper's methodology, results, significance, and more — seven facets brought into focus.
Impact
Paper Details
Authors
PDF Preview
Key Terms
Citation Network
Current paper (gray), citations (green), references (blue)
Display is limited for performance on very large graphs.
Discussion 0