SPOT: Open Source framework for scientific data repository and interactive visualization
Publication
Metrics
AI Quick Summary
SPOT is an open-source tool for interactive data visualization of multi-dimensional datasets, providing a web-based interface with features like aggregation and filtering, while following FAIR principles for reusable data.
Paper Preview
Abstract
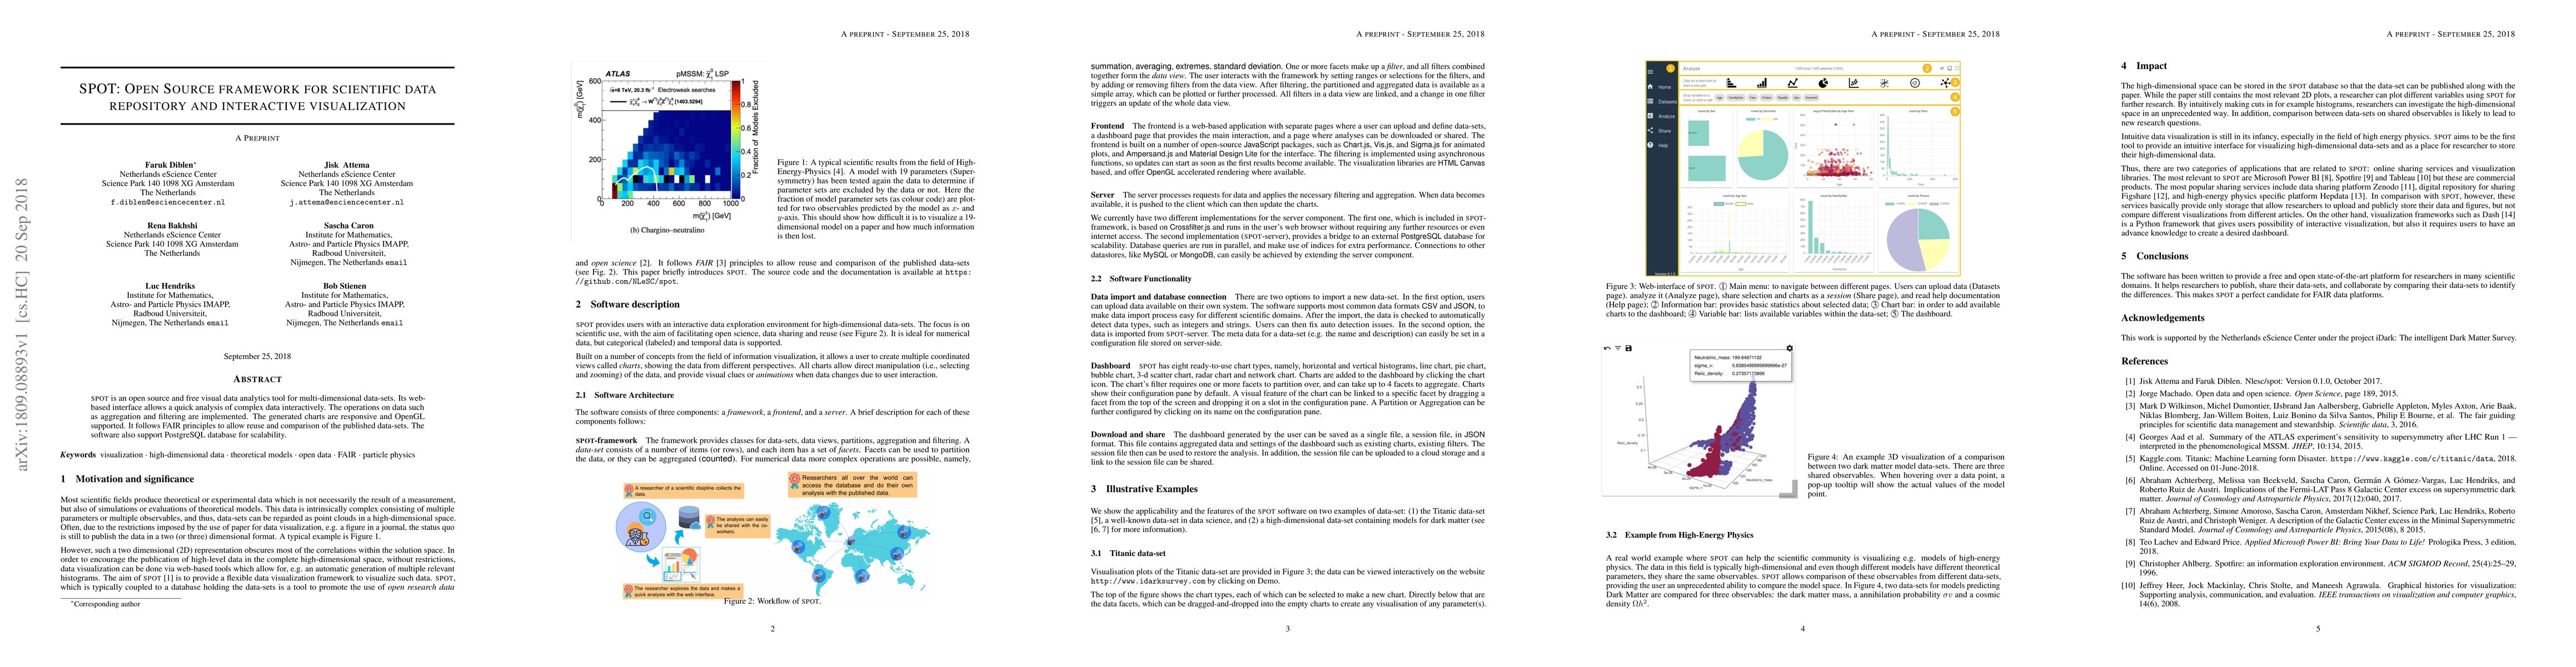
SPOT is an open source and free visual data analytics tool for multi-dimensional data-sets. Its web-based interface allows a quick analysis of complex data interactively. The operations on data such as aggregation and filtering are implemented. The generated charts are responsive and OpenGL supported. It follows FAIR principles to allow reuse and comparison of the published data-sets. The software also support PostgreSQL database for scalability.
AI Key Findings
Get AI-generated insights about this paper's methodology, results, significance, and more — seven facets brought into focus.
Impact
Paper Details
PDF Preview
Key Terms
Citation Network
Current paper (gray), citations (green), references (blue)
Display is limited for performance on very large graphs.
Discussion 0