Stochastic Evolution of Stock Market Volume-Price Distributions
Publication
Metrics
AI Quick Summary
This study analyzes NYSM volume-price distributions using four models, finding the inverse Gamma distribution best fits the data. The research then models the inverse Gamma parameters' evolution via Langevin equations, offering insights into stock market mechanisms.
Paper Preview
Abstract
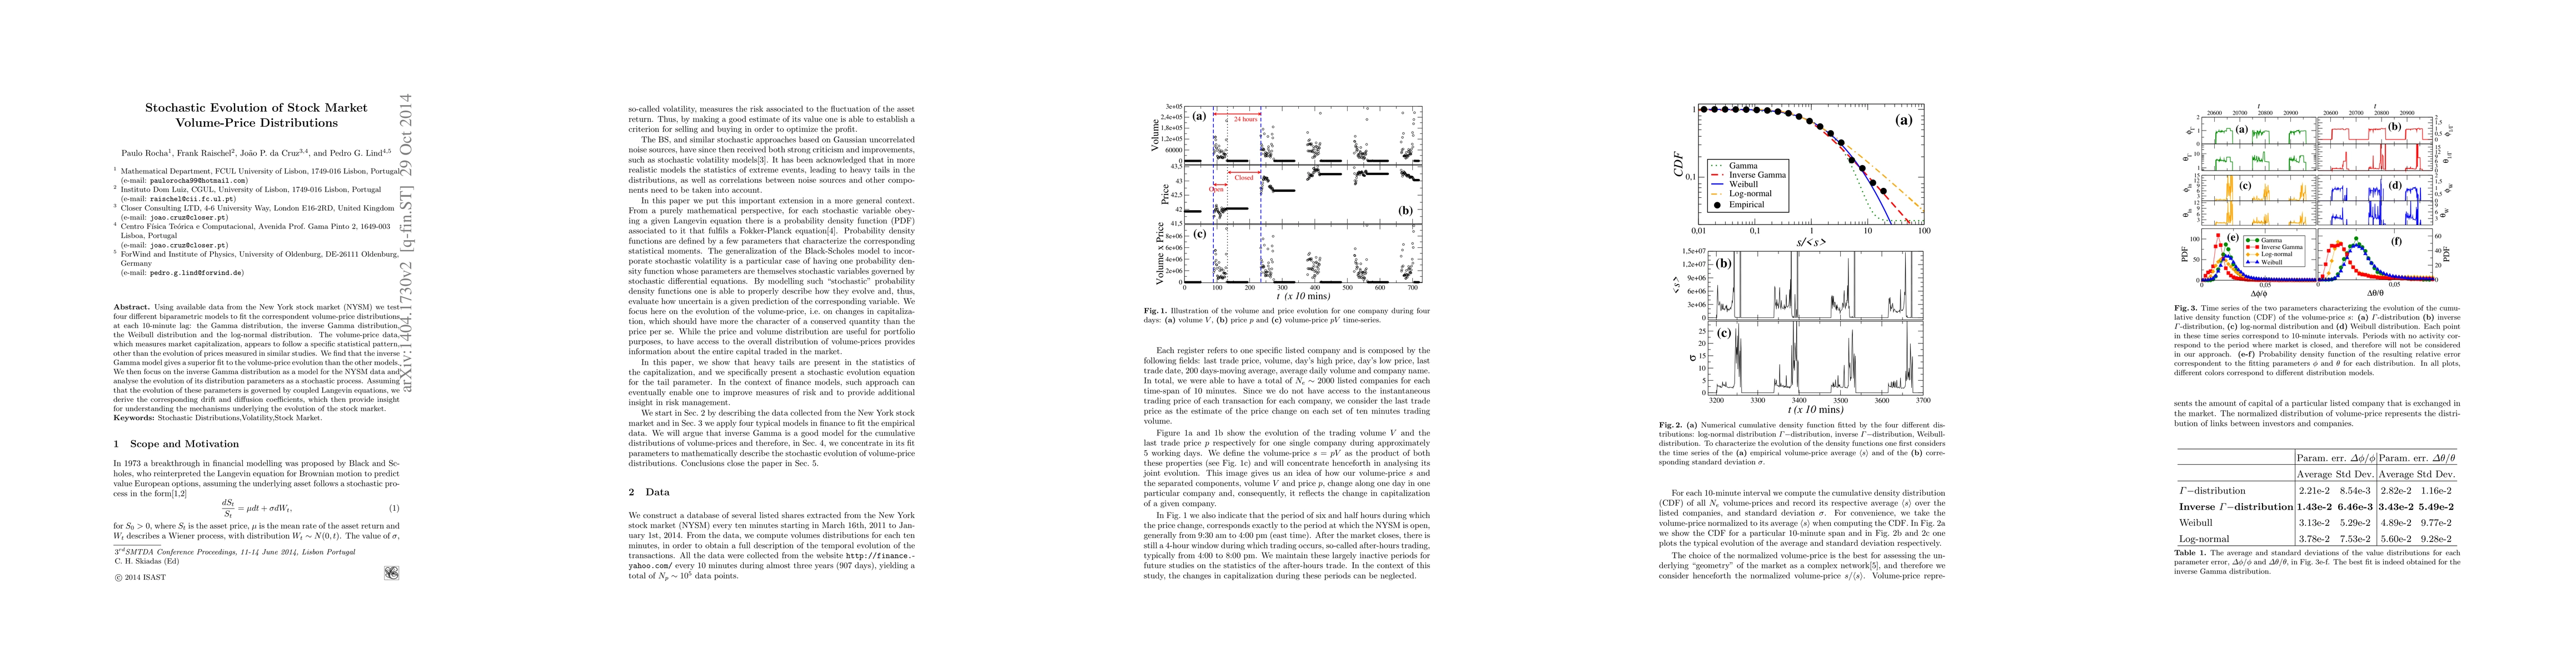
Using available data from the New York stock market (NYSM) we test four different bi-parametric models to fit the correspondent volume-price distributions at each $10$-minute lag: the Gamma distribution, the inverse Gamma distribution, the Weibull distribution and the log-normal distribution. The volume-price data, which measures market capitalization, appears to follow a specific statistical pattern, other than the evolution of prices measured in similar studies. We find that the inverse Gamma model gives a superior fit to the volume-price evolution than the other models. We then focus on the inverse Gamma distribution as a model for the NYSM data and analyze the evolution of the pair of distribution parameters as a stochastic process. Assuming that the evolution of these parameters is governed by coupled Langevin equations, we derive the corresponding drift and diffusion coefficients, which then provide insight for understanding the mechanisms underlying the evolution of the stock market.
AI Key Findings
Get AI-generated insights about this paper's methodology, results, significance, and more — seven facets brought into focus.
Impact
Paper Details
PDF Preview
Key Terms
Citation Network
Current paper (gray), citations (green), references (blue)
Display is limited for performance on very large graphs.
Discussion 0