Background
The paper sits at the intersection of probability theory, fuzzy logic, and decision analysis. It acknowledges that real-world uncertainty is often described linguistically rather than precisely quantified, and that traditional probability theory does not directly accommodate vagueness in human judgments. Fuzzy set theory, linguistic variables, and prior work on mapping verbal probability expressions to numbers provide context for why researchers have pursued alternative representations of uncertainty. The novelty here is to fuse these ideas with Bayesian reasoning inside influence diagrams, which are graph-based representations of probabilistic influence and decision-making structures.
Problem / Research Question
The central question is how to perform stochastic sensitivity analysis when inputs are uncertain in a linguistic, fuzzy manner rather than as exact probabilities, and how to do so without re-solving the entire problem for every changed probability point. The authors aim to preserve Bayes’ rule and probabilistic rigor while enabling efficient sensitivity analysis and richer interpretability through fuzzy representations of probability.
Innovation / Contribution
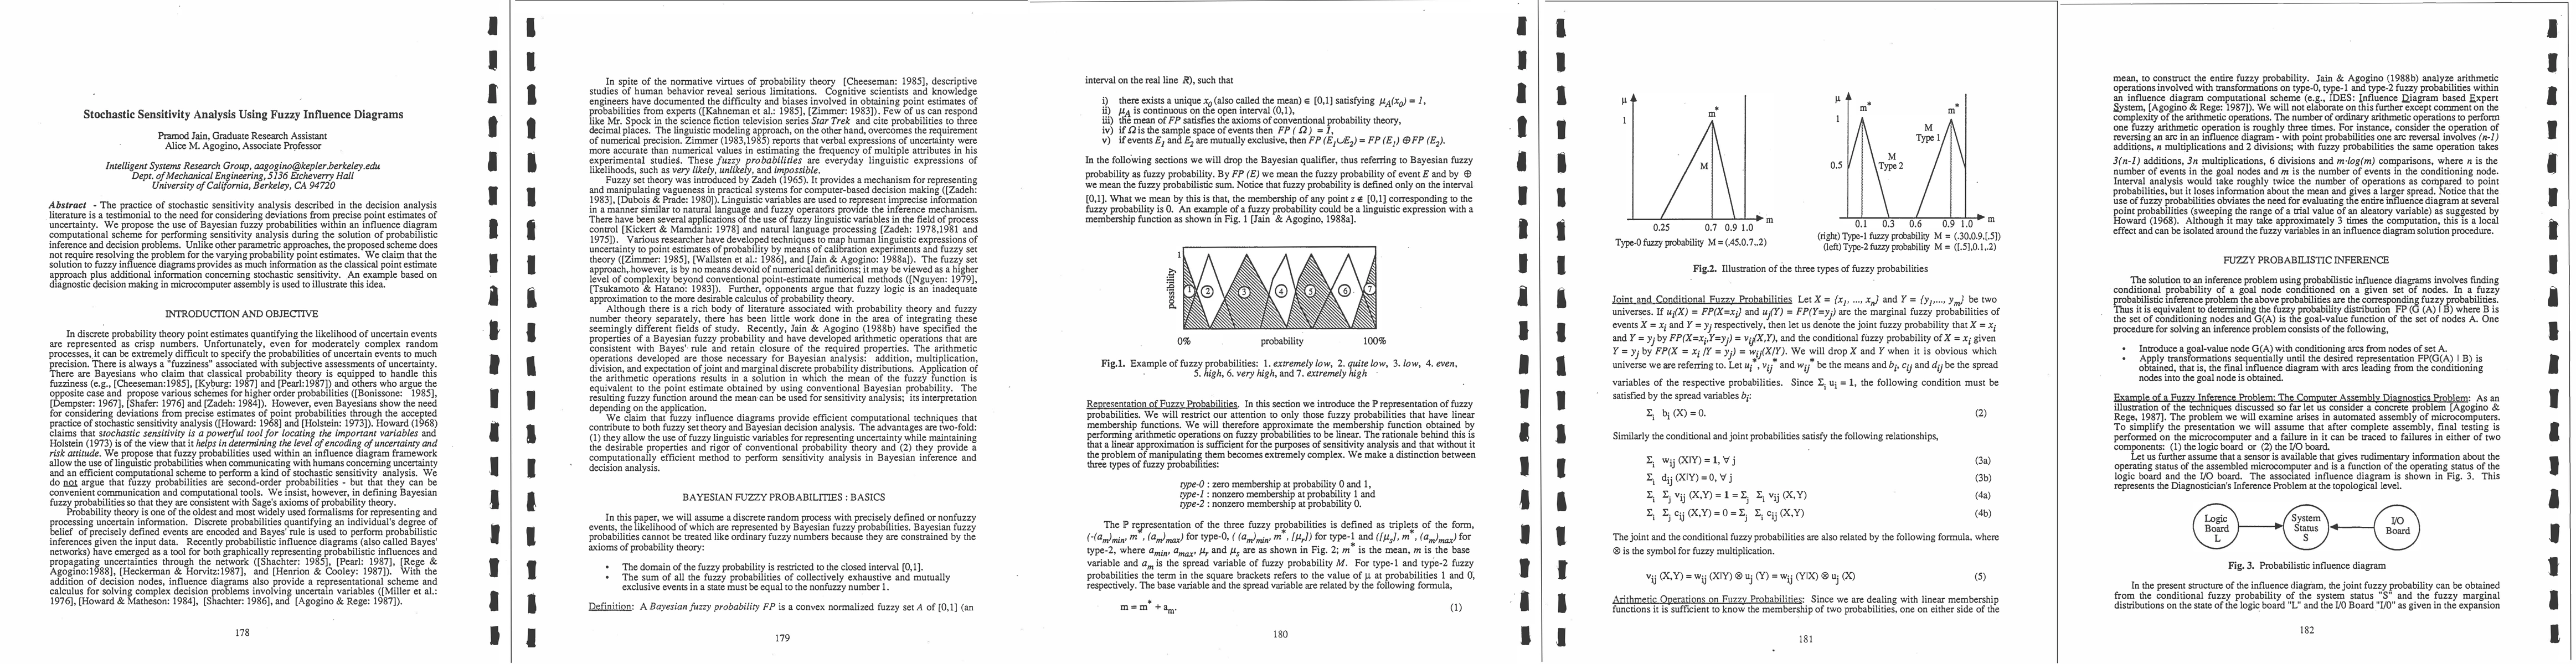
Two main contributions are offered: (1) a formalization of Bayesian fuzzy probabilities (FP) that are constrained to [0,1] and sum to 1 across exhaustive, mutually exclusive events, with arithmetic operations aligned to Bayesian updating; and (2) the integration of FP into influence diagrams to support probabilistic inference and decision analysis with built-in sensitivity analysis. The approach yields a mean that matches the conventional point estimate while the surrounding fuzzy structure provides a quantified sense of uncertainty and robustness. The paper also discusses dominance concepts (such as a*-intersection) and alternative methods for comparing fuzzy cost functions to identify when a point-estimate decision remains optimal with high possibility.
Methodology / Approach
The authors treat a discrete random process with nonfuzzy events and Bayesian fuzzy probabilities as the input. They define FP as a convex normalized fuzzy set on [0,1], ensuring the probability axioms hold in a fuzzy sense. Arithmetic operations necessary for Bayesian analysis (addition, multiplication, division, and expectation) are developed so that inference within the network remains closed and coherent. Influence diagrams serve as the computational backbone: likelihoods are propagated through the diagram with fuzzy arithmetic, and the resulting fuzzy costs or utilities are examined via their membership functions to assess sensitivity. The approach yields a distribution of possible expected costs/usages rather than a single fixed value, enabling a nuanced interpretation of how probability uncertainty affects decisions.
Experiments / Evaluation
A diagnostic decision-making scenario in microcomputer assembly is used as the concrete testbed. The paper reports that the fuzzy framework produces a meaningful sensitivity signal: the intersection point a* (where membership functions meet) provides a measure of how susceptible the optimal decision is to the probability values. In the example, the intersection suggests that the decision based on point estimates is unconditionally optimal with a high probability (roughly 94%), indicating relative insensitivity within the examined range. The mean of the fuzzy function aligns with the conventional Bayesian point estimate, while the surrounding fuzzy information supplies a richer picture of robustness.
Key Results
The key results are methodological and practical: Bayesian fuzzy probabilities can be manipulated within influence diagrams without sacrificing probabilistic coherence; the mean solution coincides with the traditional point-estimate solution, and the fuzzy structure yields a transparent sensitivity profile. The diagnostic example demonstrates how the approach quantifies the likelihood that the chosen decision remains optimal under plausible probability variations, offering a concrete metric (e.g., ~94% robustness to the point-estimate decision in the illustrated case).
Practical Applications
The method is especially suited to expert systems and decision-support tools where experts prefer linguistic uncertainty expressions, or where stakeholders require interpretable sensitivity information. It supports communication with users who find numeric probabilities opaque while maintaining a rigorous probabilistic backbone. Potential applications span manufacturing diagnostics, reliability planning, medical decision support, and any domain requiring robust decision-making under imperfect probability estimates.
Limitations & Considerations
The paper acknowledges ongoing debates about fuzzy logic as an approximation to probability theory and notes that a careful definition of Bayesian fuzzy probabilities is essential to maintain coherence with Bayes’ rule. While the authors emphasize computational efficiency, the approach introduces the need to calibrate linguistic variables and interpret membership functions, which may complicate deployment and require domain-specific calibration experiments. The discrete-event assumption and the dependences on the chosen fuzzy arithmetic rules could limit generalizability to all problems or continuous spaces without further extension.
Discussion 0