Background
Influence diagrams model decisions, uncertainties, and preferences, and decision circuits extend arithmetic circuits by incorporating maximization nodes that represent sequential decision problems. Sensitivity analysis in belief networks is well understood due to linear relationships, but influence diagrams introduce non-linearities through decision maximization and non-linear utilities. Prior work has explored information value and simpler parameter perturbations, but non-linear sensitivity analysis for influence diagrams remained challenging and computationally intensive when the policy structure changes or when hedging or risk attitudes are varied.
Problem / Research Question
The paper asks how to perform three non-linear sensitivity analyses without re-evaluating the entire decision problem: (1) how to compare strategies when only one decision’s policy is altered while others stay at their current optimum, (2) how to analyze sensitivity to risk aversion given an exponential utility, and (3) how to compute the value of perfect hedging for any uncertainty. Each question requires navigating non-linear effects introduced by maximization and utility, yet the authors aim to obtain answers directly from derivative information readily available in the decision circuit.
Innovation / Contribution
The core contributions are three sensitivity analysis methods that rely on derivatives computed on the decision circuit rather than re-solving the problem. First, Theorem 1 shows how to compute the CE when changing the policy for a single decision while keeping other decisions fixed at their current optimal policies, facilitating policy comparisons with lower computational cost. Second, Theorem 2 provides a mechanism to compute the gradient of CE with respect to a parameter ν of the utility function, paving the way for sensitivity to risk attitude. Theorem 3 then delivers a closed-form expression for CE as a function of the risk aversion parameter γ in the exponential utility, enabling efficient exploration of how risk posture affects the CE across a range of γ values without re-solving the model. Third, Theorems 4 and 5 establish how to compute the value of perfect hedging (VoPH) and the optimal hedge Y that can be deterministically tied to uncertainty X, again utilizing derivatives that are available from the circuit’s sweeps.
Methodology / Approach
All analyses build on a compiled decision circuit for the influence diagram. After a forward (upward) sweep computes the circuit’s value and a backward (downward) sweep yields the derivatives of the root with respect to evidence indicators and parameters, the results summarize to a small set of quantities:
- For strategy comparisons, the derivative structure lets us express the CE under a modified policy as a function of the current derivatives, avoiding a full re-optimization.
- For risk aversion, the derivative with respect to the utility parameter ν and a derived closed-form CE(γ) allow plotting and comparing how the CE changes as γ varies, while acknowledging that the optimal strategy may change if γ moves far from the original value.
- For VoPH, the theorems show how to construct the conditional CE given X, compute its expectation, and derive the hedge y(x) and VoPH from four circuit sweeps, keeping computations local to the current strategy.
Key practical notes include that the complexity of policy-change CE calculation scales with the number of observations for the decision in question, and that the risk-aversion analysis yields a computationally efficient closed-form trajectory as γ varies, within the fixed-strategy regime.
Experiments / Evaluation
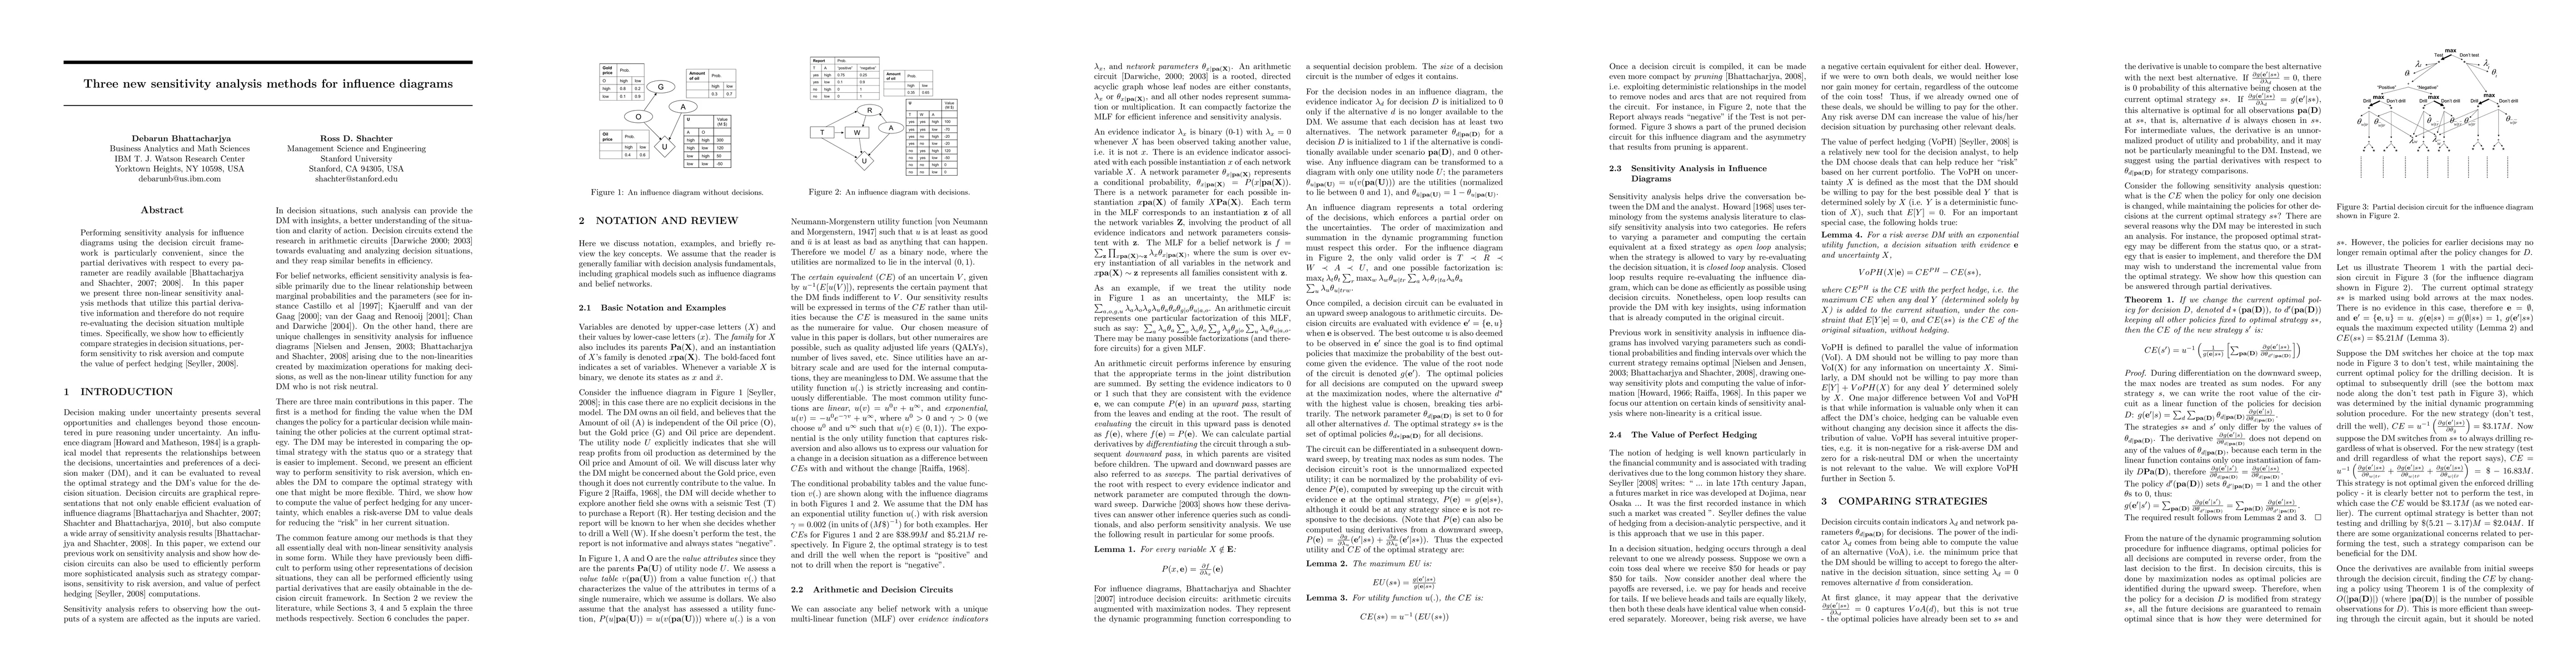
The authors illustrate their methods using classic influence diagram examples (Figures 1–5) and discuss how the procedures unfold on these models. They show, for instance, how small policy changes can be evaluated to compare alternative strategies without re-optimizing, and they demonstrate the risk-aversion analysis by evaluating CE across different γ values (e.g., 0.002 or 0.01 in their narrative) to reveal crossover points and the value of flexibility. The VoPH discussion includes a concrete table of VoPH values for distinct uncertainties in a portfolio-like example and discusses how a proposed hedge price compares to these bounds. Although the paper centers on theoretical development and illustrative examples rather than large-scale empirical benchmarking, the demonstrations emphasize the practical speedups and interpretability gained by avoiding repeated re-evaluation.
Key Results
The paper formalizes five theorems that enable non-linear sensitivity analysis directly from decision-circuit derivatives:
- Theorem 1 gives the CE for a modified policy at a single decision, with other policies fixed, showing how to compute incremental value without re-solving.
- Theorem 2 derives the partial derivative of CE with respect to a utility-parameter ν, enabling local risk-attribute sensitivity where the decision problem is held fixed.
- Theorem 3 provides a closed-form CE(γ) for exponential utilities, yielding a tractable path for examining risk aversion effects without re-optimizing, though with the caveat that the optimal strategy may shift if γ changes substantially.
- Theorem 4 defines the perfect hedge Y(x) and expresses VoPH as the difference between the expected conditional CE and the unhedged CE, ensuring non-negativity for risk-averse DMs under the fixed strategy.
- Theorem 5 shows how to compute E[CE(s*|X)] and the conditional CE using derivatives, enabling VoPH to be evaluated with four circuit sweeps and then applied to any X in constant time per value.
Collectively, these results demonstrate that a broad class of non-linear sensitivity questions can be answered efficiently from a fixed decision circuit, dramatically reducing computational burden compared to naive re-solve-and-re-evaluate approaches.
Practical Applications
Practically, the methods equip analysts and decision makers with fast tools to: (i) compare near-optimal or feasible policies without abandoning the current operational baseline, (ii) quantify how much risk posture matters for value and how much flexibility a different policy could provide, and (iii) price hedging opportunities that could reduce risk in portfolios or deal terms. Because the results rely on derivatives available from the circuit’s forward and backward sweeps, they scale more gracefully to larger problems than fully re-solving every time a parameter or policy changes.
Limitations & Considerations
A key caveat is that several results are derived under a fixed optimal strategy; significant changes to the strategy itself could invalidate the fixed-policy assumption, necessitating re-optimization. Although Theorem 3 provides a closed-form CE trajectory in γ, the authors note that a substantial change in γ can alter the optimal policy, so the CE path is informative but not guaranteed to reflect the new optimum. The framework hinges on exponential utility for the risk-aversion results, so extending to other utility families may require additional derivations or approximations. Finally, the methods assume a properly compiled decision circuit with decisions, uncertainties, and a single utility node; applying them to models with continuous decisions, non-standard payoff structures, or complex deterministic relationships may require careful adaptation and circuit pruning strategies.
Discussion 0