Stock data analysis using sympbolic data analysis
Publication
Metrics
AI Quick Summary
This paper introduces a model for stock exchange analysis using symbolic data analysis and SODAS software, detailing the choice, definition, and analysis of symbolic objects. It concludes with perspectives on enhancing SODAS for better stock market domain applications.
Paper Preview
Abstract
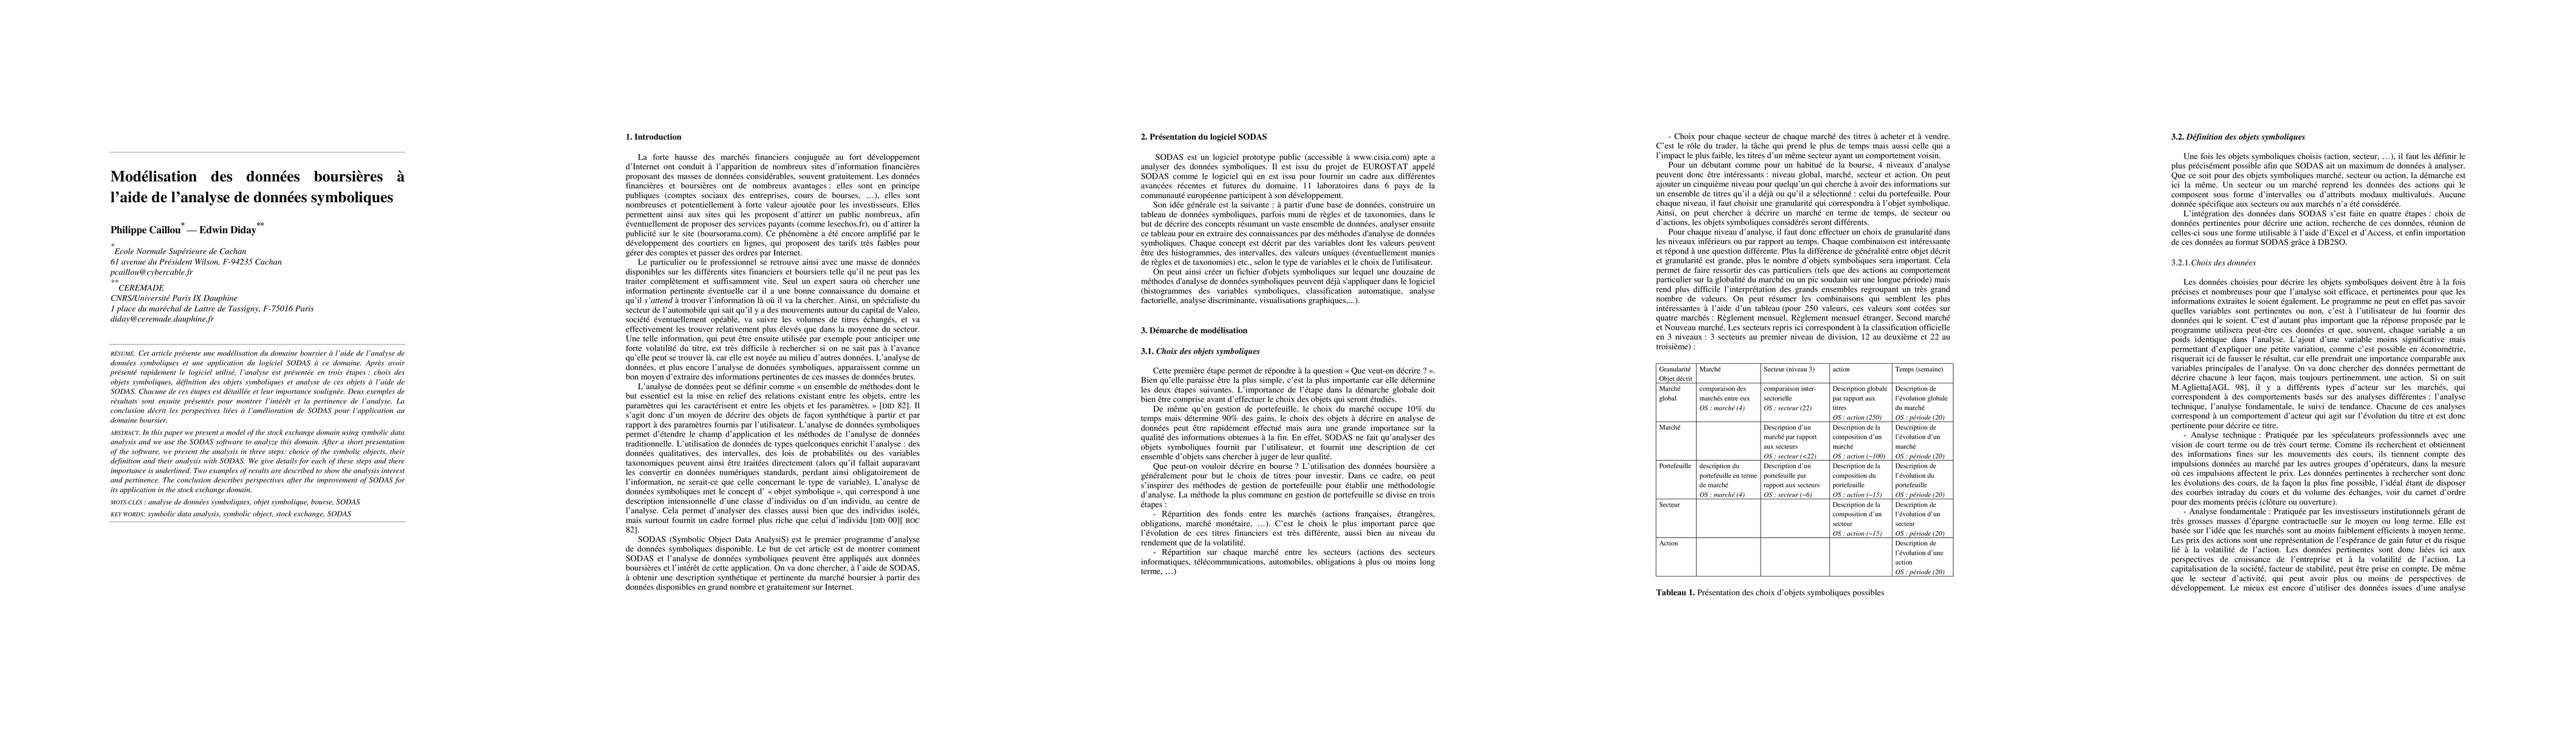
In this paper we present a model of the stock exchange domain using symbolic dataanalysis and we use the SODAS software to analyze this domain. After a short presentationof the software, we present the analysis in three steps: choice of the symbolic objects, theirdefinition and their analysis with SODAS. We give details for each of these steps and thereimportance is underlined. Two examples of results are described to show the analysis interestand pertinence. The conclusion describes perspectives after the improvement of SODAS forits application in the stock exchange domain.
AI Key Findings
Get AI-generated insights about this paper's methodology, results, significance, and more — seven facets brought into focus.
Impact
Paper Details
Authors
PDF Preview
Key Terms
Citation Network
Current paper (gray), citations (green), references (blue)
Display is limited for performance on very large graphs.
Discussion 0