Studying Visualization Guidelines According to Grounded Theory
Publication
Metrics
AI Quick Summary
Researchers studied visualization guidelines using Grounded Theory, analyzing 248 posts from an online forum for insights into their development and application. The study aims to establish a theoretical foundation for visualization guidelines.
Paper Preview
Abstract
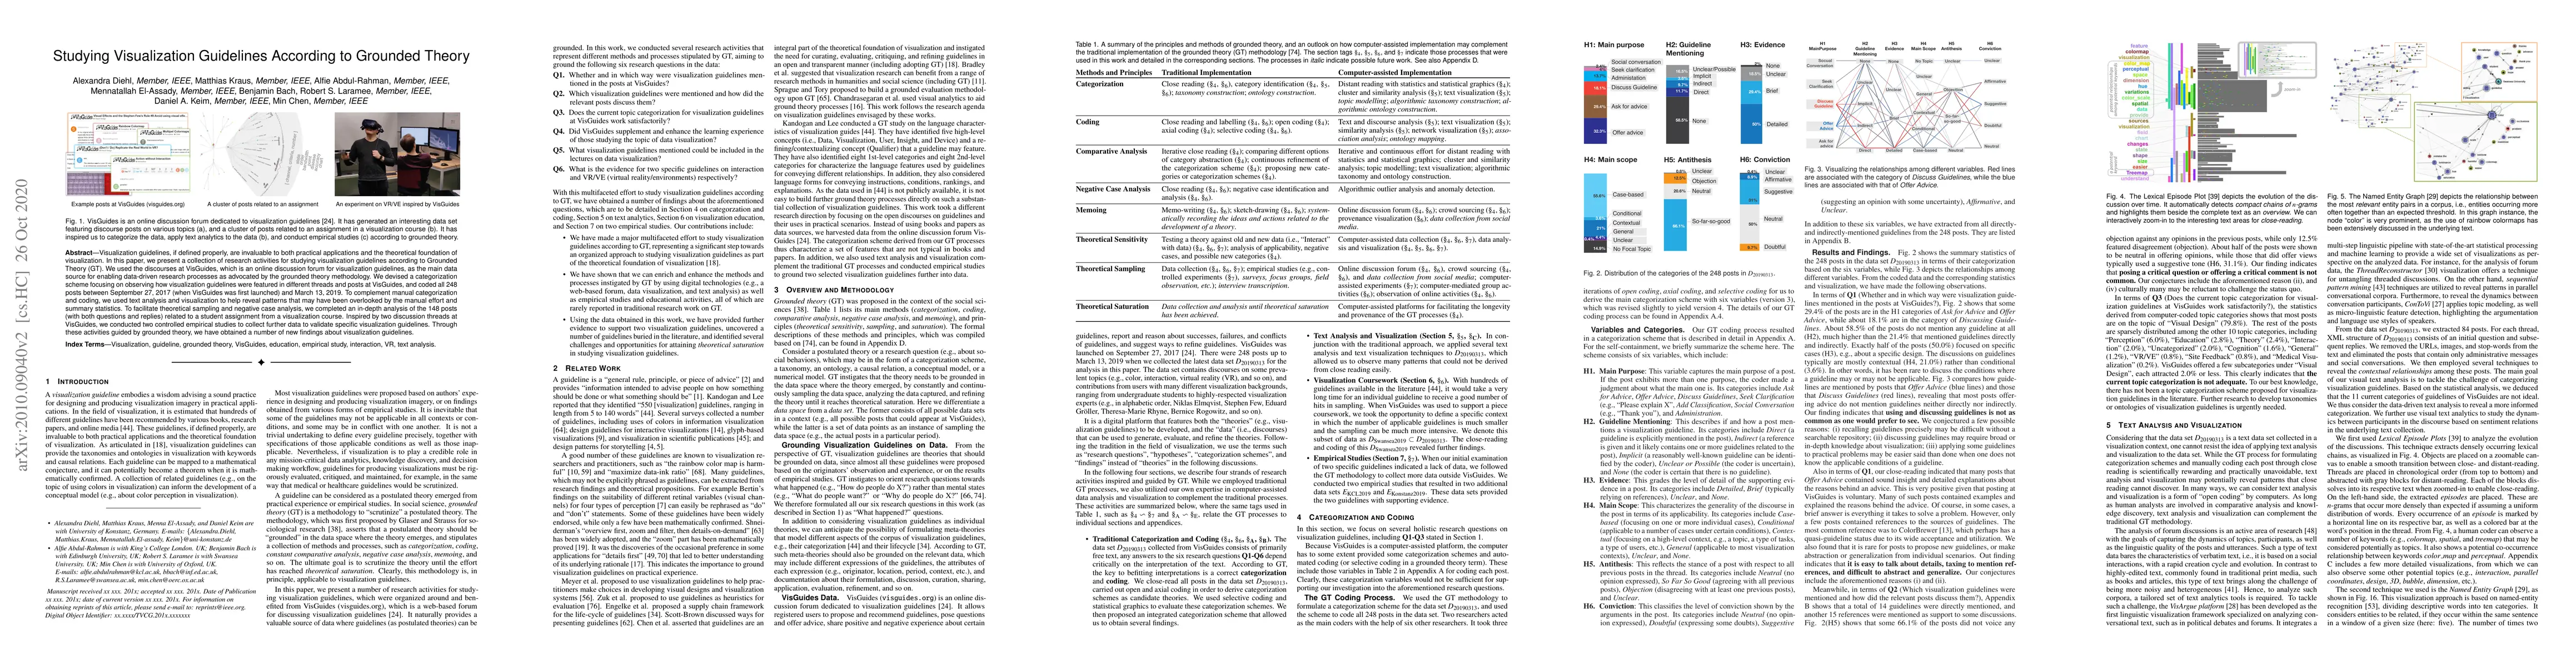
Visualization guidelines, if defined properly, are invaluable to both practical applications and the theoretical foundation of visualization. In this paper, we present a collection of research activities for studying visualization guidelines according to Grounded Theory (GT). We used the discourses at VisGuides, which is an online discussion forum for visualization guidelines, as the main data source for enabling data-driven research processes as advocated by the grounded theory methodology. We devised a categorization scheme focusing on observing how visualization guidelines were featured in different threads and posts at VisGuides, and coded all 248 posts between September 27, 2017 (when VisGuides was first launched) and March 13, 2019. To complement manual categorization and coding, we used text analysis and visualization to help reveal patterns that may have been missed by the manual effort and summary statistics. To facilitate theoretical sampling and negative case analysis, we made an in-depth analysis of the 148 posts (with both questions and replies) related to a student assignment of a visualization course. Inspired by two discussion threads at VisGuides, we conducted two controlled empirical studies to collect further data to validate specific visualization guidelines. Through these activities guided by grounded theory, we have obtained some new findings about visualization guidelines.
AI Key Findings
Get AI-generated insights about this paper's methodology, results, significance, and more — seven facets brought into focus.
Impact
Paper Details
Authors
PDF Preview
Key Terms
Citation Network
Current paper (gray), citations (green), references (blue)
Display is limited for performance on very large graphs.
Discussion 0