ArxivLens

Quick Summary:

This paper explores the concept of visualization onboarding, aiming to enhance users' understanding and interaction with complex data visualizations. It surveys educational theories and commercial strategies to provide guidelines for effective onboarding design in the visualization domain.

Journal Reference: Springer Nature 2022
arXiv Id: 2203.11134
Date Published: 2022-03-22
Date Updated: 2022-03-22

Categories:

Key Terms (TF-IDF):

visualization (0.376)
design (0.219)
community (0.213)
design (0.209)
community (0.207)
users (0.200)
concept (0.191)
users (0.186)
support (0.183)
concept (0.177)
knowledge (0.173)
support (0.170)
structures (0.167)
knowledge (0.166)
structures (0.158)
commercial (0.157)
dealing (0.155)
academic (0.153)
considerations (0.148)
commercial (0.148)
License: http://creativecommons.org/licenses/by-nc-nd/4.0/

Summary:

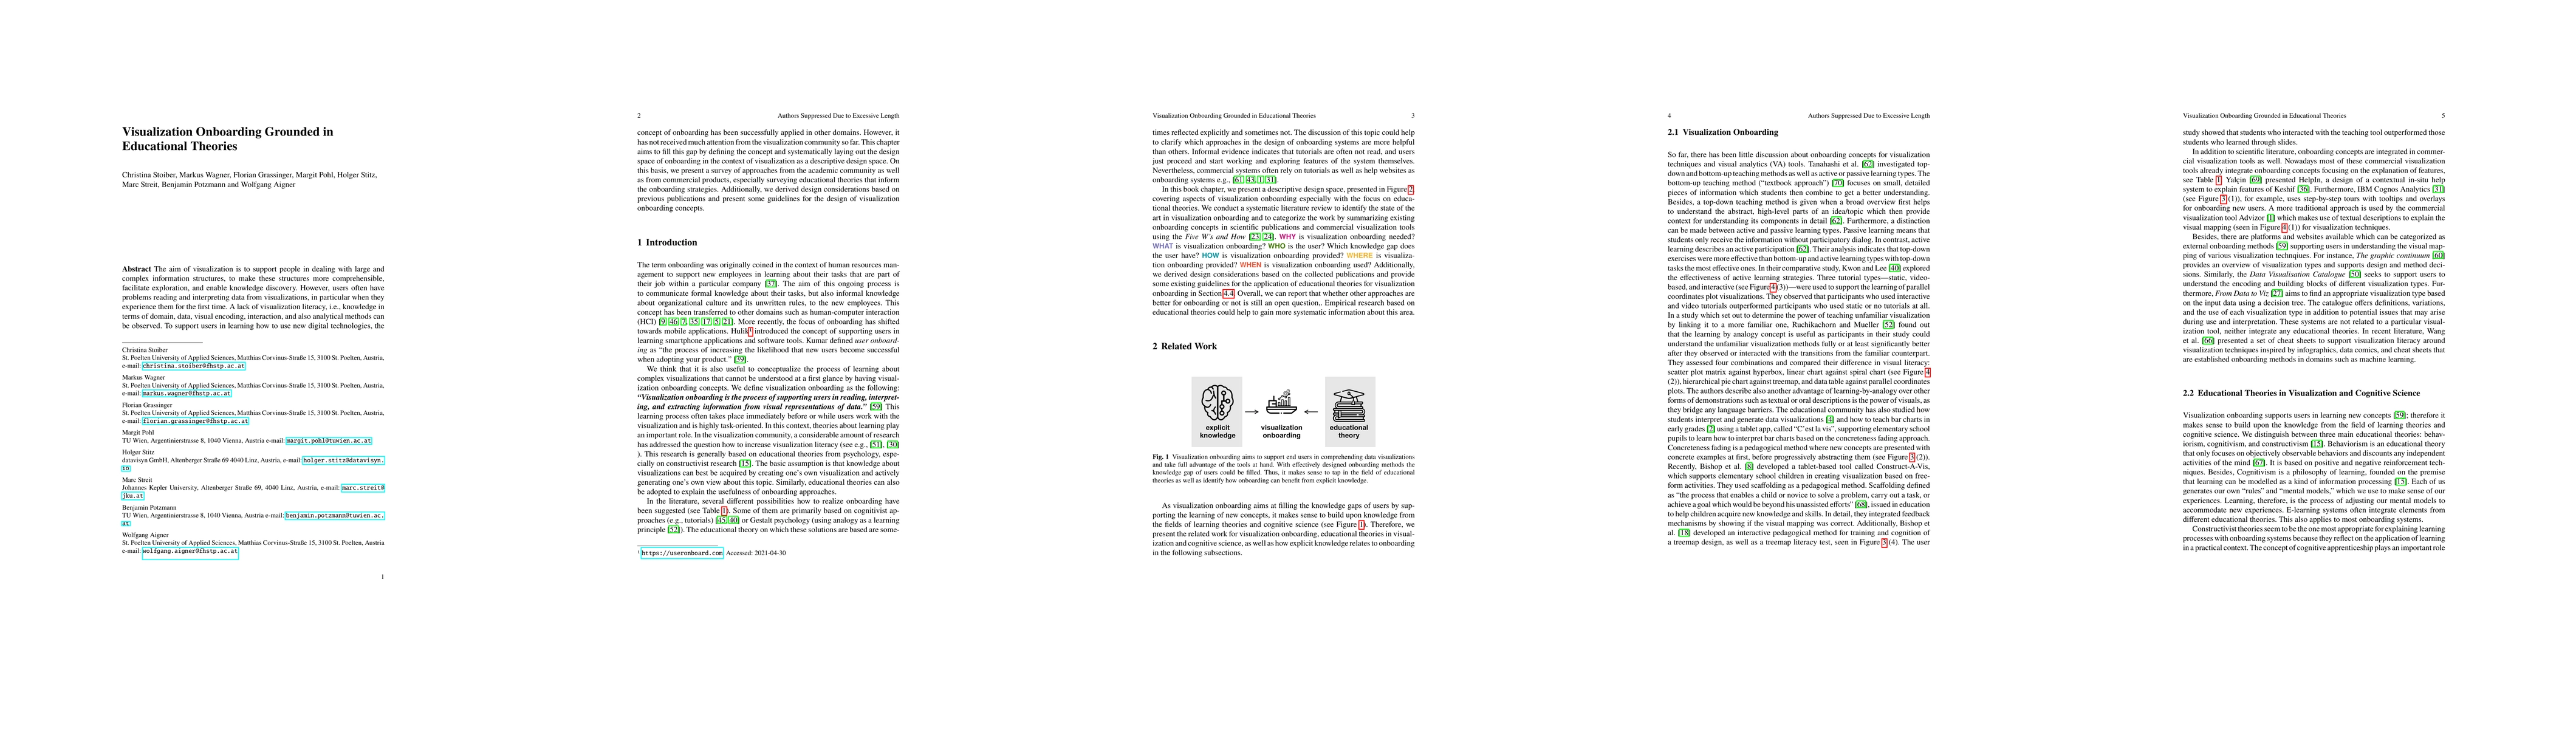
The aim of visualization is to support people in dealing with large and complex information structures, to make these structures more comprehensible, facilitate exploration, and enable knowledge discovery. However, users often have problems reading and interpreting data from visualizations, in particular when they experience them for the first time. A lack of visualization literacy, i.e., knowledge in terms of domain, data, visual encoding, interaction, and also analytical methods can be observed. To support users in learning how to use new digital technologies, the concept of onboarding has been successfully applied in other domains. However, it has not received much attention from the visualization community so far. This chapter aims to fill this gap by defining the concept and systematically laying out the design space of onboarding in the context of visualization as a descriptive design space. On this basis, we present a survey of approaches from the academic community as well as from commercial products, especially surveying educational theories that inform the onboarding strategies. Additionally, we derived design considerations based on previous publications and present some guidelines for the design of visualization onboarding concepts.

Citation & Reference Network Visualization

This graph shows how this paper is connected to other research. The current paper is shown in dark gray, papers that cite it are in green, and papers it references are in blue. You can:

Current Paper
Papers citing this work (Citations)
Papers cited by this work (References)

• Hover over any node to see the paper title

• Click a node to view that paper's details

• Drag nodes to rearrange the graph

• Use the zoom controls (bottom right) to zoom in/out

Citations and References

Title Authors Year Actions
A Design Space of Behavior Change Interventions for Responsible Data Science
Ziwei Dong, Teanna Barrett, Ameya B Patil, Yuichi Shoda, Leilani Battle, Emily Wall
2025
View Paper
Complexity as Design Material Position Paper
Florian Windhager, Alfie Abdul-Rahman, Mark-Jan Bludau, Nicole Hengesbach, Houda Lamqaddam, Isabel Meirelles, Bettina Speckmann, Michael Correll
2024
View Paper
Does This Have a Particular Meaning? Interactive Pattern Explanation for Network Visualizations
Xinhuan Shu, Alexis Pister, Junxiu Tang, Fanny Chevalier, Benjamin Bach
2024
View Paper
Open Your Ears and Take a Look: A State‐of‐the‐Art Report on the Integration of Sonification and Visualization
Kajetan Enge, Elias Elmquist, V. Caiola, N. Rönnberg, A. Rind, Michael Iber, Sara Lenzi, Fangfei Lan, Robert Höldrich, W. Aigner
2024
View Paper
Design Actions for the Design of Visualization Onboarding Methods
Christina Stoiber, M. Pohl, Wolfgang Aigner
2023
View Paper
Educational Data Comics: What can Comics do for Education in Visualization?
Magdalena Boucher, Benjamin Bach, Christina Stoiber, Zezhong Wang, Wolfgang Aigner
2023
View Paper
Enhancing Decision Making in MDO through Interactive Visual Analytics on the Web
Javier Henriques-Gil, Daniel Mejia Parra, Bruno Simões
2023
View Paper
Authoring tool for Data Journalists integrating Self-Explanatory Visualization Onboarding Concept for a Treemap Visualization
Christina Stoiber, Sonja Radkohl, Florian Grassinger, Daniela Moitzi, Holger Stitz, Eva Goldgruber, Dominic Girardi, Wolfgang Aigner
2023
View Paper
VisAhoi: Towards a Library to Generate and Integrate Visualization Onboarding Using High-level Visualization Grammars
Christina Stoiber, Daniela Moitzi, Holger Stitz, Florian Grassinger, Anto Silviya Geo Prakash, Dominic Girardi, M. Streit, W. Aigner
2023
View Paper
Using Data Comics to Enhance Visualization Literacy
Magdalena Boucher, Christina Stoiber, W. Aigner
2022
View Paper

Similar Papers

Comparative Evaluations of Visualization Onboarding Methods

Wolfgang Aigner, Christina Stoiber, Holger Stitz, Florian Grassinger, Marc Streit, Conny Walchshofer, Margit Pohl, Benjamin Potzmann

Published: 2022-07-12

Perspectives of Visualization Onboarding and Guidance in VA

Markus Wagner, Wolfgang Aigner, Silvia Miksch, Davide Ceneda, Christina Stoiber, Marc Streit, Victor Schetinger, Theresia Gschwandtner

Published: 2023-08-21

VisAhoi: Towards a Library to Generate and Integrate Visualization Onboarding Using High-level Visualization Grammars

Wolfgang Aigner, Christina Stoiber, Daniela Moitzi, Holger Stitz, Florian Grassinger, Anto Silviya Geo Prakash, Dominic Girardi, Marc Streit

Published: 2023-09-01

Charting a Path to Efficient Onboarding: The Role of Software Visualization

Ronnie de Souza Santos, Fernando Padoan, Rodrigo Pessoa Medeiros

Published: 2024-01-19

Comments (0)

This website uses cookies to ensure you get the best experience. Learn more