VisAhoi: Towards a Library to Generate and Integrate Visualization Onboarding Using High-level Visualization Grammars
Publication
Metrics
AI Quick Summary
VisAhoi is a new library designed to generate and integrate visualization onboarding, supporting diverse visualization types and datasets. It utilizes high-level visualization grammars like Vega-Lite, Plotly.js, and ECharts to create onboarding instructions, demonstrated through applications in high-throughput screening data analysis and data journalism tools.
Paper Preview
Abstract
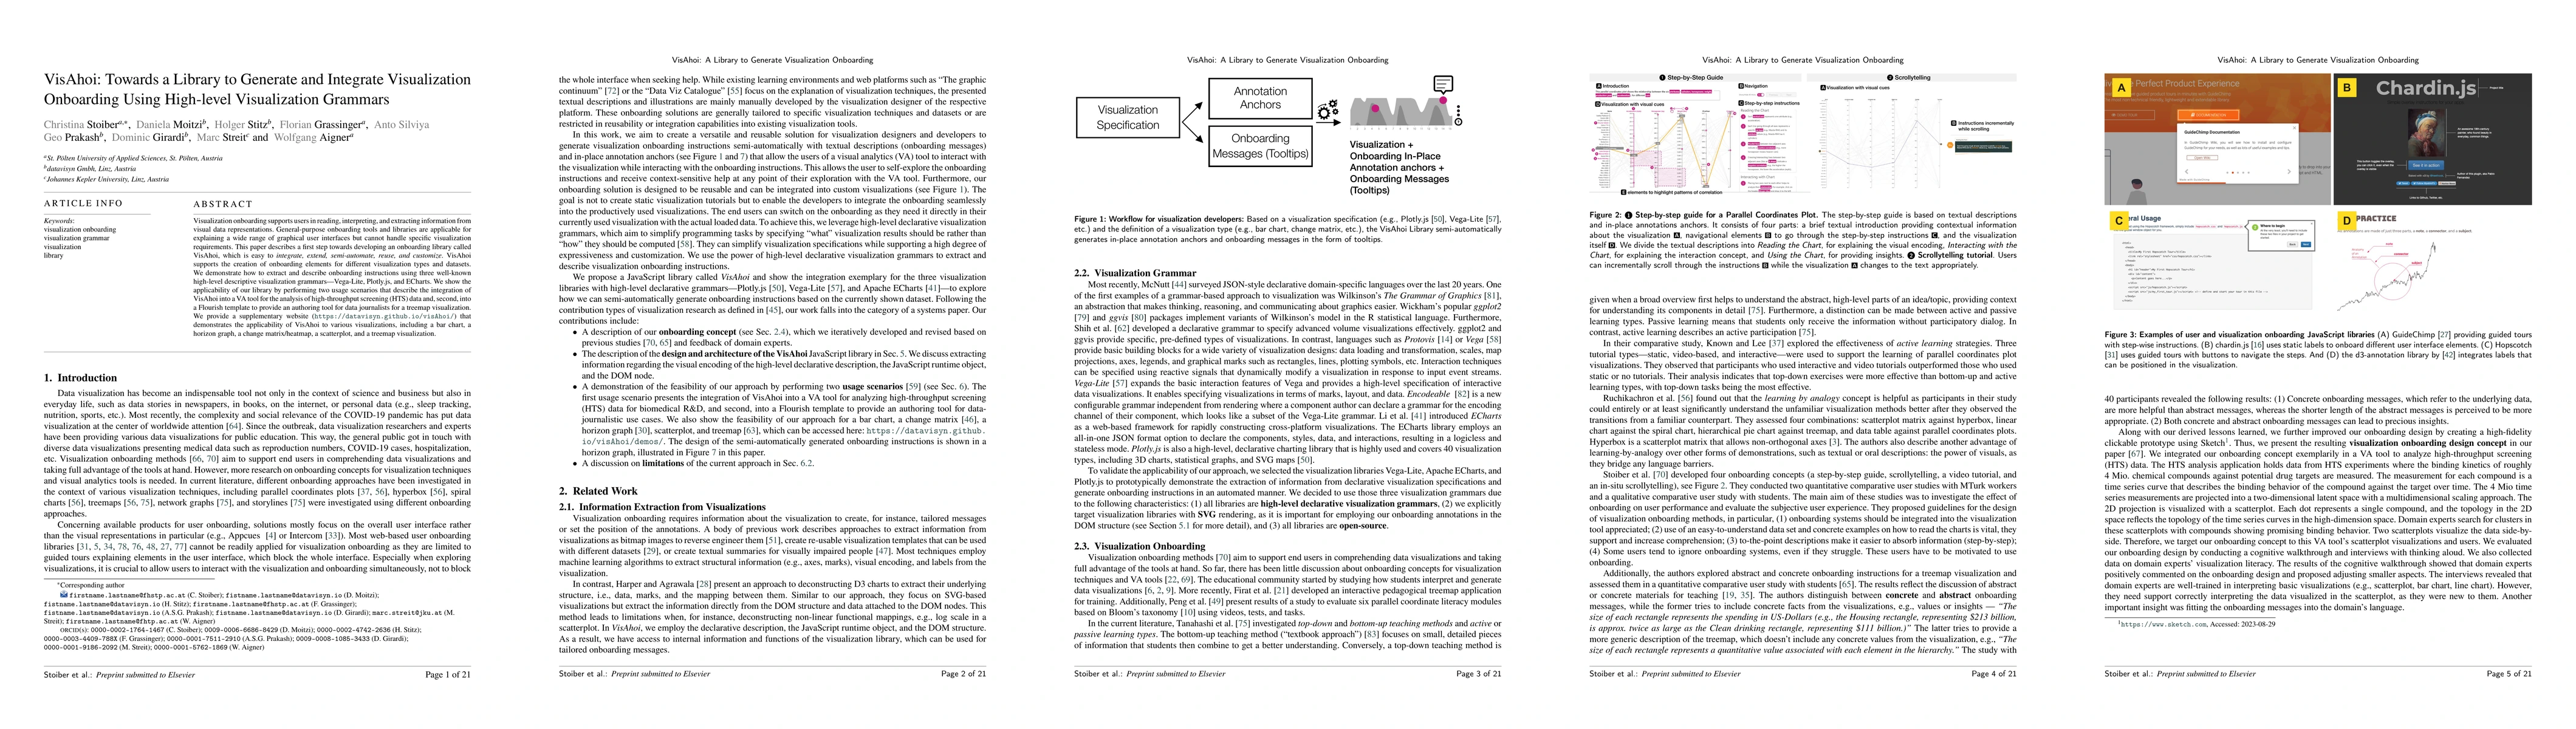
Visualization onboarding supports users in reading, interpreting, and extracting information from visual data representations. General-purpose onboarding tools and libraries are applicable for explaining a wide range of graphical user interfaces but cannot handle specific visualization requirements. This paper describes a first step towards developing an onboarding library called VisAhoi, which is easy to integrate, extend, semi-automate, reuse, and customize. VisAhoi supports the creation of onboarding elements for different visualization types and datasets. We demonstrate how to extract and describe onboarding instructions using three well-known high-level descriptive visualization grammars - Vega-Lite, Plotly.js, and ECharts. We show the applicability of our library by performing two usage scenarios that describe the integration of VisAhoi into a VA tool for the analysis of high-throughput screening (HTS) data and, second, into a Flourish template to provide an authoring tool for data journalists for a treemap visualization. We provide a supplementary website that demonstrates the applicability of VisAhoi to various visualizations, including a bar chart, a horizon graph, a change matrix or heatmap, a scatterplot, and a treemap visualization.
AI Key Findings
Get AI-generated insights about this paper's methodology, results, significance, and more — seven facets brought into focus.
Impact
Paper Details
Authors
PDF Preview
Key Terms
Citation Network
Current paper (gray), citations (green), references (blue)
Display is limited for performance on very large graphs.
Discussion 0