This paper explores the integration of visualization onboarding and guidance in Visual Analytics (VA) to assist domain experts unfamiliar with VA systems. It proposes a conceptual model based on the Knowledge-Assisted Visual Analytics framework, highlighting the benefits of combining these approaches to enhance user experience and broaden VA's accessibility.
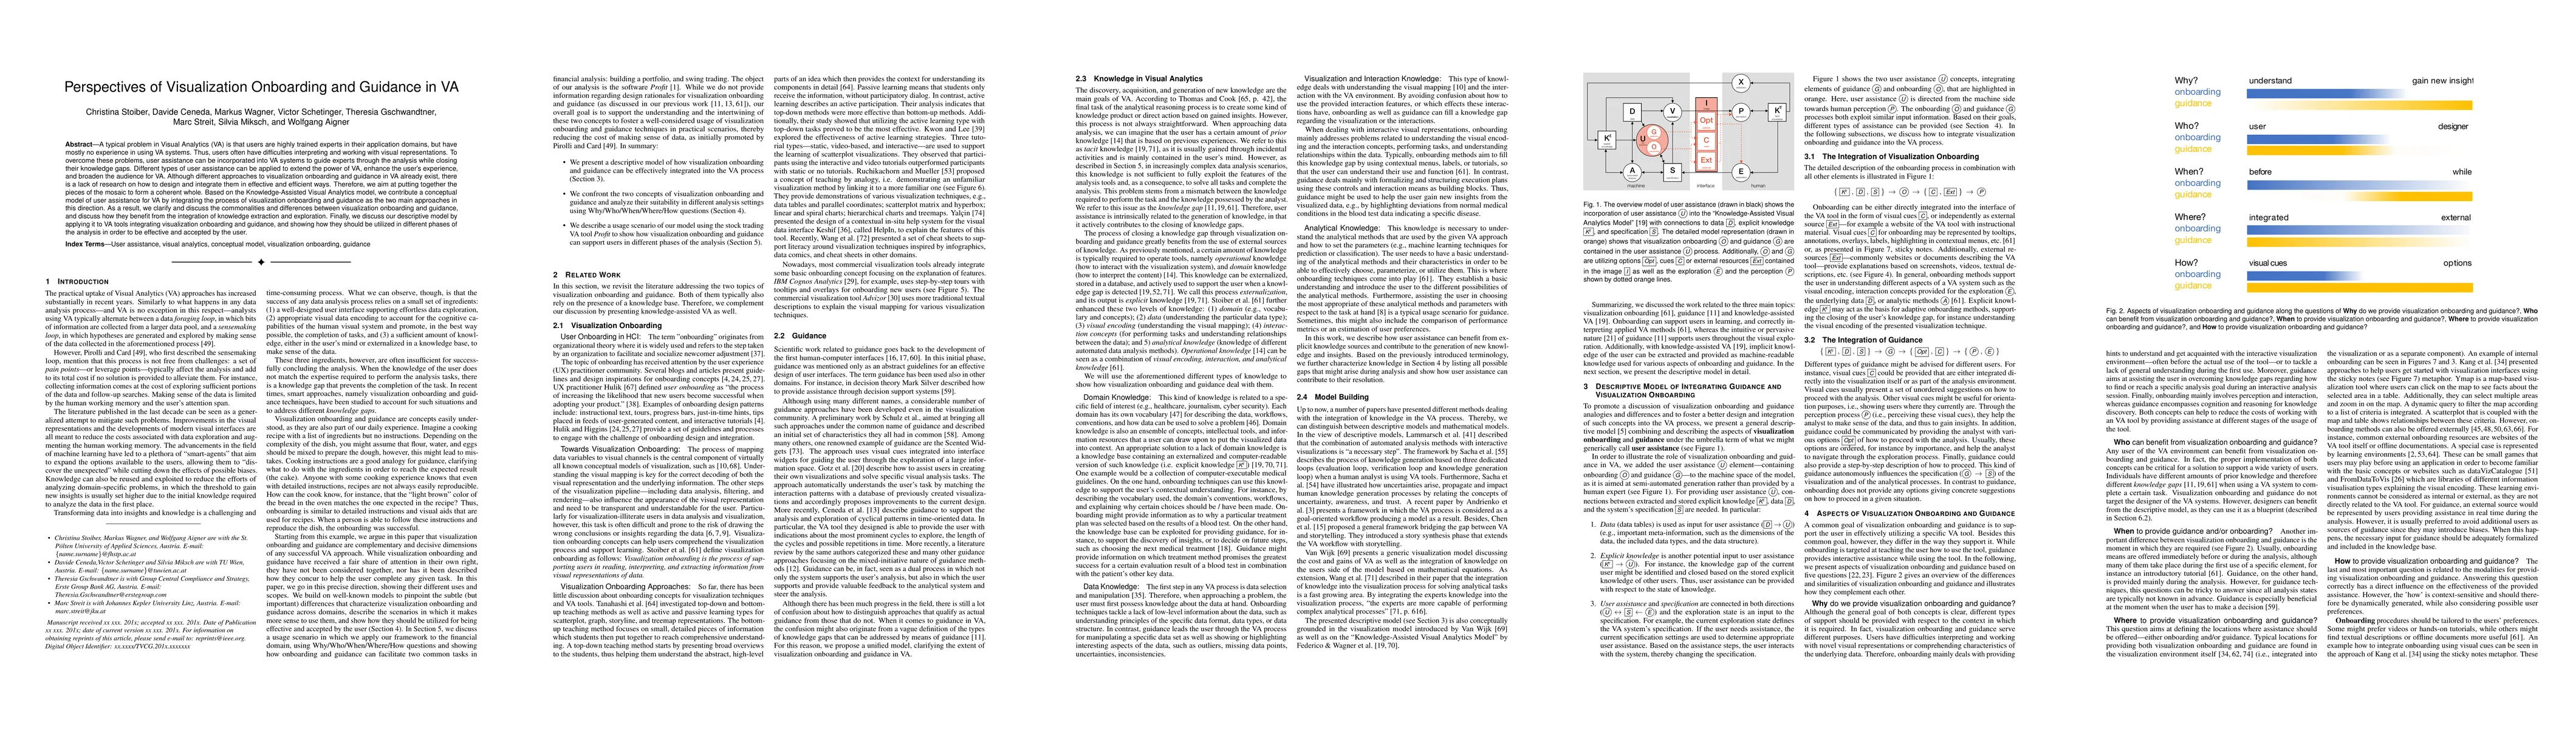
A typical problem in Visual Analytics is that users are highly trained experts in their application domains, but have mostly no experience in using VA systems. Thus, users often have difficulties interpreting and working with visual representations. To overcome these problems, user assistance can be incorporated into VA systems to guide experts through the analysis while closing their knowledge gaps. Different types of user assistance can be applied to extend the power of VA, enhance the user's experience, and broaden the audience for VA. Although different approaches to visualization onboarding and guidance in VA already exist, there is a lack of research on how to design and integrate them in effective and efficient ways. Therefore, we aim at putting together the pieces of the mosaic to form a coherent whole. Based on the Knowledge-Assisted Visual Analytics model, we contribute a conceptual model of user assistance for VA by integrating the process of visualization onboarding and guidance as the two main approaches in this direction. As a result, we clarify and discuss the commonalities and differences between visualization onboarding and guidance, and discuss how they benefit from the integration of knowledge extraction and exploration. Finally, we discuss our descriptive model by applying it to VA tools integrating visualization onboarding and guidance, and showing how they should be utilized in different phases of the analysis in order to be effective and accepted by the user.
This graph shows how this paper is connected to other research. The current paper is shown in dark gray, papers that cite it are in green, and papers it references are in blue. You can:
• Hover over any node to see the paper title
• Click a node to view that paper's details
• Drag nodes to rearrange the graph
• Use the zoom controls (bottom right) to zoom in/out
Title | Authors | Year | Actions |
---|---|---|---|
DashGuide: Authoring Interactive Dashboard Tours for Guiding Dashboard Users
|
Naimul Hoque, N. Sultanum
|
2025
|
View Paper |
A Design Space of Behavior Change Interventions for Responsible Data Science
|
Ziwei Dong, Teanna Barrett, Ameya B Patil, Yuichi Shoda, Leilani Battle, Emily Wall
|
2025
|
View Paper |
FactExplorer: Fact Embedding-Based Exploratory Data Analysis for Tabular Data
|
Qi Jiang, Guodao Sun, Yue Dong, Lvhan Pan, Baofeng Chang, Li Jiang, Haoran Liang, Ronghua Liang
|
2025
|
View Paper |
Towards Understanding the Impact of Guidance in Data Visualization Systems for Domain Experts
|
Sherry Qiu, Holly Rushmeier, Kim R. M. Blenman
|
2024
|
View Paper |
ConAn: Measuring and Evaluating User Confidence in Visual Data Analysis Under Uncertainty
|
Maath Musleh, Davide Ceneda, Henry Ehlers, R. Raidou
|
2024
|
View Paper |
Beyond Correlation: Incorporating Counterfactual Guidance to Better Support Exploratory Visual Analysis
|
Arran Zeyu Wang, D. Borland, David Gotz
|
2024
|
View Paper |
From Instruction to Insight: Exploring the Functional and Semantic Roles of Text in Interactive Dashboards
|
N. Sultanum, V. Setlur
|
2024
|
View Paper |
Audio-visual training and feedback to learn touch-based gestures
|
Sadia Rubab, Muhammad Wajeeh Uz Zaman, Umer Rashid, Lingyun Yu, Yingcai Wu
|
2024
|
View Paper |
Enhancing Data Literacy On-demand: LLMs as Guides for Novices in Chart Interpretation.
|
Kiroong Choe, Chaerin Lee, S. Lee, Jiwon Song, Aeri Cho, Nam Wook Kim, Jinwook Seo
|
2024
|
View Paper |
Dowsing: a task-driven approach for multiple-view visualizations dynamic recommendation
|
Jiamin Zhu, Meixuan Wu, Yi Zhou, Nan Cao, Haotian Zhu, Min Zhu
|
2024
|
View Paper |
LEVA: Using Large Language Models to Enhance Visual Analytics
|
Yuheng Zhao, Yixing Zhang, Yu Zhang, Xinyi Zhao, Junjie Wang, Zekai Shao, C. Turkay, Siming Chen
|
2024
|
View Paper |
Evaluating the Recommendations of LLMs to Teach a Visualization Technique Using Bloom's Taxonomy
|
Alark Joshi, Chandana Srinivas, Elif E. Firat, R. Laramee
|
2024
|
View Paper |
Educational Data Comics: What can Comics do for Education in Visualization?
|
Magdalena Boucher, Benjamin Bach, Christina Stoiber, Zezhong Wang, Wolfgang Aigner
|
2023
|
View Paper |
Design Actions for the Design of Visualization Onboarding Methods
|
Christina Stoiber, M. Pohl, Wolfgang Aigner
|
2023
|
View Paper |
A Heuristic Approach for Dual Expert/End-User Evaluation of Guidance in Visual Analytics
|
D. Ceneda, C. Collins, Mennatallah El-Assady, S. Miksch, C. Tominski, Alessio Arleo
|
2023
|
View Paper |
Dimensionality reduction visualization analysis of financial data based on semantic feature group
|
Ke Wang, Menghua Luo, Xiong-lve Li, Zhiping Cai, Yang Long
|
2023
|
View Paper |
NetworkNarratives: Data Tours for Visual Network Exploration and Analysis
|
Wenchao Li, Sarah Schöttler, James Scott-Brown, Yun Wang, Siming Chen, Huamin Qu, Benjamin Bach
|
2023
|
View Paper |
Uncertainty guidance in proton therapy planning visualization
|
Maath Musleh, L. Muren, L. Toussaint, A. Vestergaard, E. Gröller, R. Raidou
|
2023
|
View Paper |
Providing visual analytics guidance through decision support
|
Wenkai Han, Hans-Jörg Schulz
|
2023
|
View Paper |
Tac-Trainer: A Visual Analytics System for IoT-based Racket Sports Training
|
Jiachen Wang, Ji Ma, K. Hu, Zheng Zhou, Hui Zhang, Xiao Xie, Yingnian Wu
|
2022
|
View Paper |
Incorporation of Human Knowledge into Data Embeddings to Improve Pattern Significance and Interpretability
|
Jie Li, Chunting Zhou
|
2022
|
View Paper |
Lotse: A Practical Framework for Guidance in Visual Analytics
|
F. Sperrle, D. Ceneda, Mennatallah El-Assady
|
2022
|
View Paper |
RASIPAM: Interactive Pattern Mining of Multivariate Event Sequences in Racket Sports
|
Jiang Wu, Dongyu Liu, Ziyang Guo, Yingnian Wu
|
2022
|
View Paper |
VisuaLizations As Intermediate Representations (VLAIR): An approach for applying deep learning-based computer vision to non-image-based data
|
Ai Jiang, Miguel A. Nacenta, Juan Ye
|
2022
|
View Paper |
Inconspicuous Guides: A Qualitative Study to Understand the Degree of Intrusiveness in Visualization Onboarding
|
Margit Pohl, Benjamin Potzmann, Christina Stoiber, Wolfgang Aigner
|
2025
|
View Paper |
A Review on Data Terminology in Visual Analytics Tools
|
Johanna Schmidt, Milena Vuckovic
|
2024
|
View Paper |
A Methodology for Task-Driven Guidance Design
|
I. Pérez-Messina, D. Ceneda, S. Miksch
|
2023
|
View Paper |
Physical Traces and Digital Stories: Exploring the Connections Between Forensics and Visualization
|
V. Schetinger, Saminu M. Salisu
|
2022
|
View Paper |
Comparative Analysis Of Different Comparative Analysis of Different Content Delivery Modes in E-learning Settings: A Quantitative Evaluation in Tertiary Education Sector
|
Dr. M. Amaad Uppal, Dr. Samnan Ali
|
2022
|
View Paper |
Using Data Comics to Enhance Visualization Literacy
|
Magdalena Boucher, Christina Stoiber, W. Aigner
|
2022
|
View Paper |
Virtual to Reality: Understanding the Role of Metaverse as a Pedagogical Strategy
|
Paulina Pui, Yun Wong, Gary Wai, Chung Wong, Piyasuda Pangsapa, Daniel Jiandong Shen
|
View Paper |
Wolfgang Aigner, Christina Stoiber, Daniela Moitzi, Holger Stitz, Florian Grassinger, Anto Silviya Geo Prakash, Dominic Girardi, Marc Streit
Published: 2023-09-01
Wolfgang Aigner, Christina Stoiber, Holger Stitz, Florian Grassinger, Marc Streit, Conny Walchshofer, Margit Pohl, Benjamin Potzmann
Published: 2022-07-12
Ronnie de Souza Santos, Fernando Padoan, Rodrigo Pessoa Medeiros
Published: 2024-01-19
Comments (0)