Subarcsecond imaging of a solar active region filament with ALMA and IRIS
Publication
Metrics
AI Quick Summary
This study uses ALMA and IRIS to provide high-resolution thermal structure maps of an active region filament, revealing variations in brightness temperature and electron density. The findings suggest that the filament's opacity changes correlate with temperature and density variations in its fine threads, challenging previous expectations based on quiescent filaments.
Paper Preview
Abstract
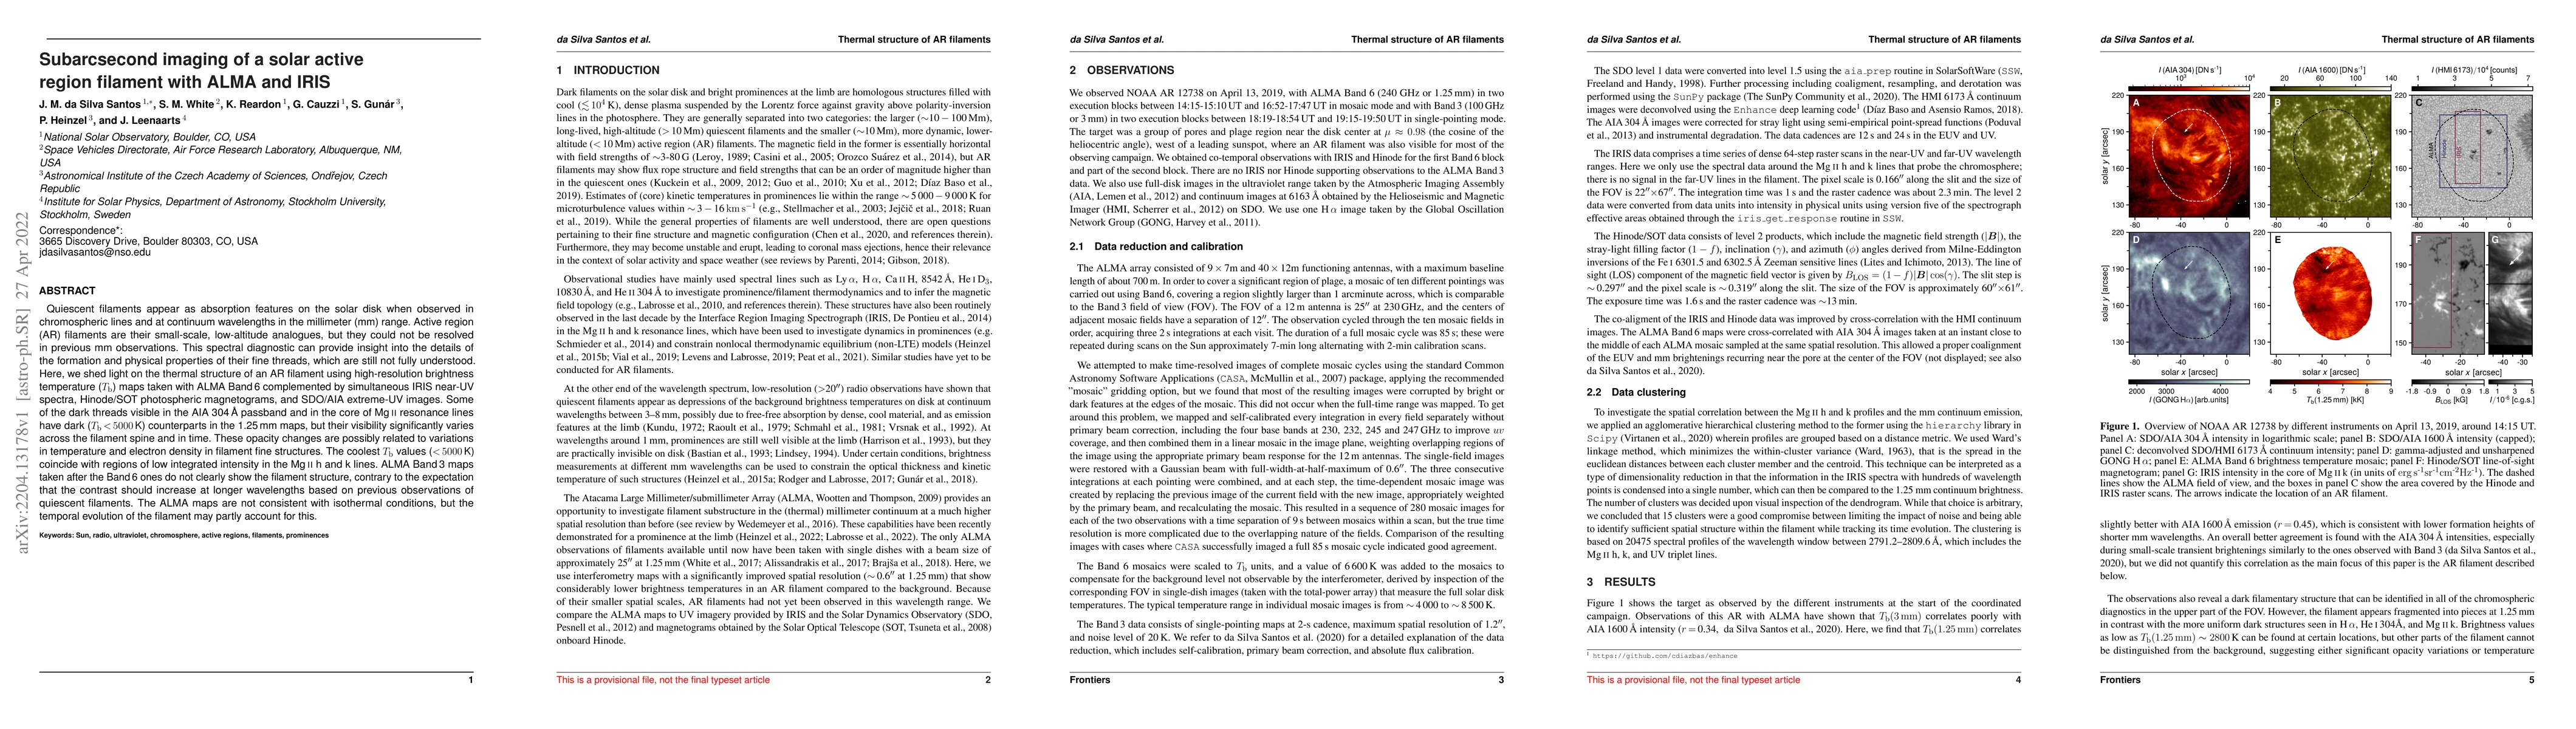
Quiescent filaments appear as absorption features on the solar disk when observed in chromospheric lines and at continuum wavelengths in the millimeter (mm) range. Active region (AR) filaments are their small-scale, low-altitude analogues, but they could not be resolved in previous mm observations. This spectral diagnostic can provide insight into the details of the formation and physical properties of their fine threads, which are still not fully understood. Here, we shed light on the thermal structure of an AR filament using high-resolution brightness temperature ($T_{\rm b}$) maps taken with ALMA Band 6 complemented by simultaneous IRIS near-UV spectra, Hinode/SOT photospheric magnetograms, and SDO/AIA extreme-UV images. Some of the dark threads visible in the AIA 304 {\AA} passband and in the core of Mg II resonance lines have dark ($T_{\rm b}<5000$K) counterparts in the 1.25 mm maps, but their visibility significantly varies across the filament spine and in time. These opacity changes are possibly related to variations in temperature and electron density in filament fine structures. The coolest $T_{\rm b}$ values ($<$5000 K) coincide with regions of low integrated intensity in the Mg II h and k lines. ALMA Band 3 maps taken after the Band 6 ones do not clearly show the filament structure, contrary to the expectation that the contrast should increase at longer wavelengths based on previous observations of quiescent filaments. The ALMA maps are not consistent with isothermal conditions, but the temporal evolution of the filament may partly account for this.
AI Key Findings
Get AI-generated insights about this paper's methodology, results, significance, and more — seven facets brought into focus.
Impact
Paper Details
Authors
PDF Preview
Key Terms
Citation Network
Current paper (gray), citations (green), references (blue)
Display is limited for performance on very large graphs.
Discussion 0