Publication
Metrics
AI Quick Summary
This paper evaluates four methods for detecting variability in X-ray light curves from eROSITA's survey, finding that amplitude maximum deviations are most effective for low false detections, while Bayesian methods perform better for stochastic variability. The results are relevant for the analysis of light curves from eROSITA's extensive survey.
Paper Preview
Abstract
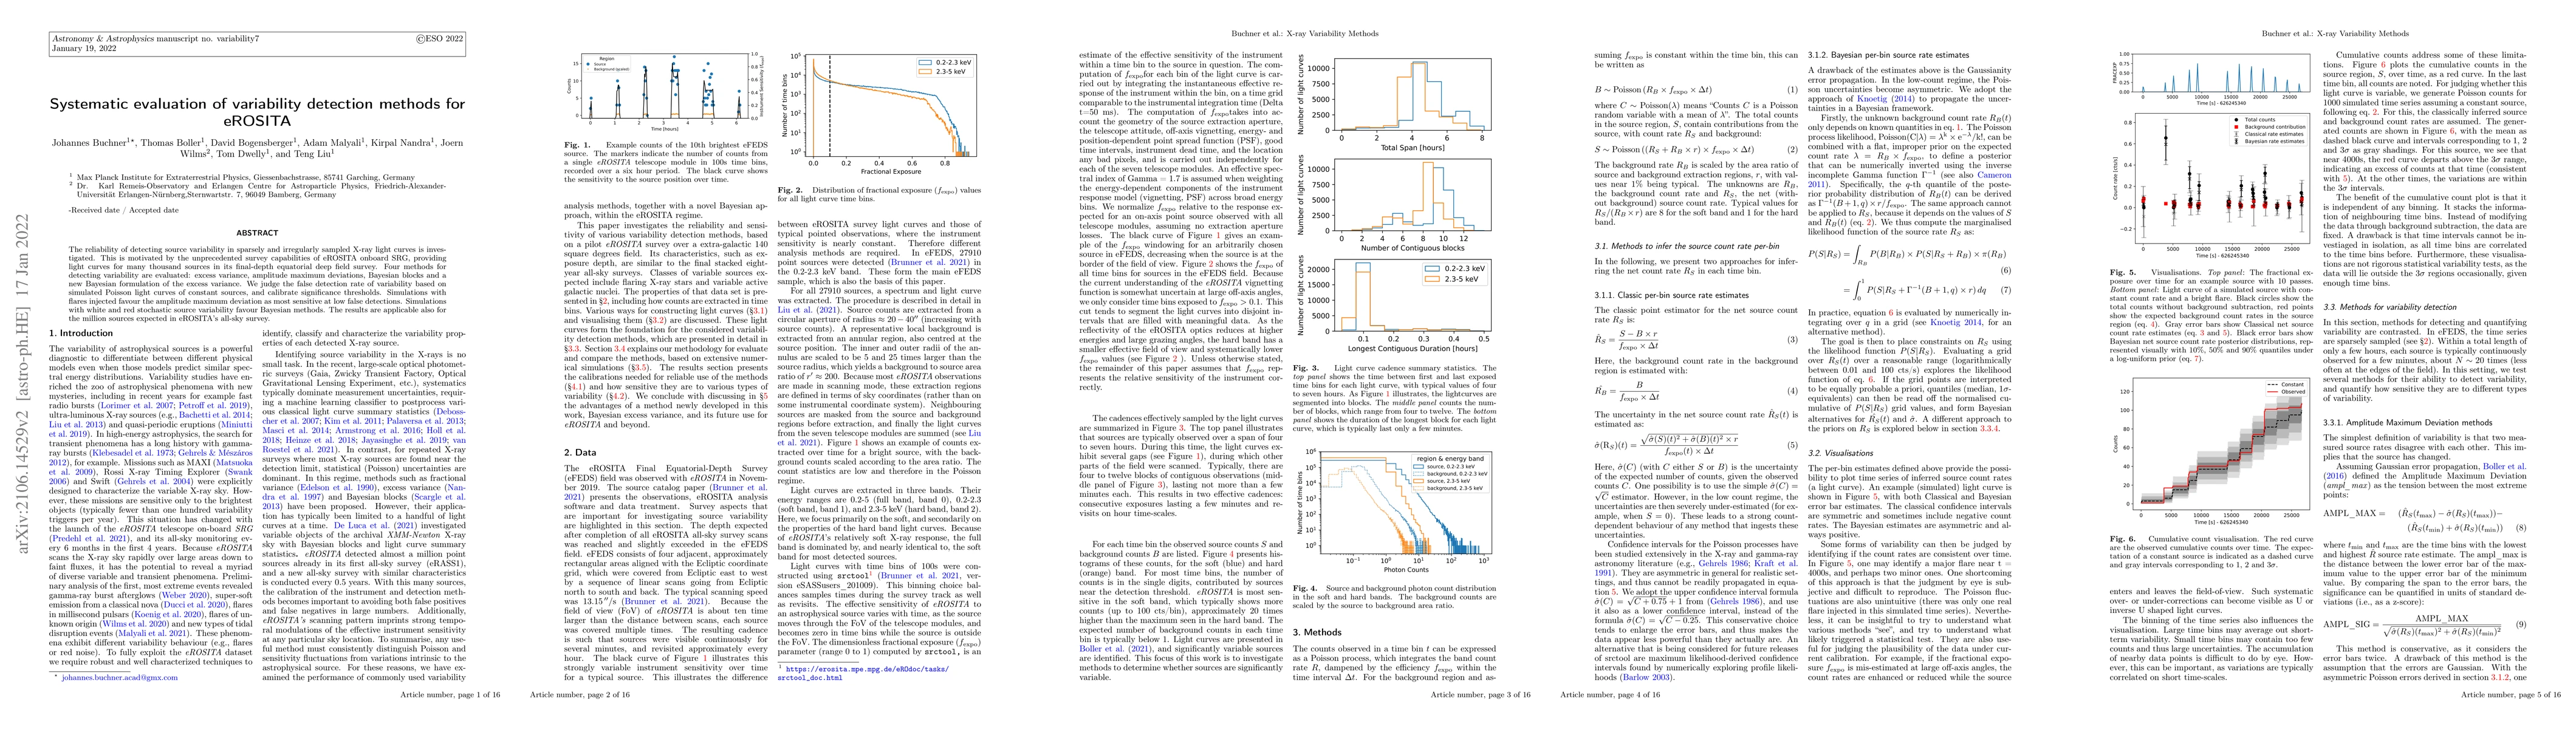
The reliability of detecting source variability in sparsely and irregularly sampled X-ray light curves is investigated. This is motivated by the unprecedented survey capabilities of eROSITA onboard SRG, providing light curves for many thousand sources in its final-depth equatorial deep field survey. Four methods for detecting variability are evaluated: excess variance, amplitude maximum deviations, Bayesian blocks and a new Bayesian formulation of the excess variance. We judge the false detection rate of variability based on simulated Poisson light curves of constant sources, and calibrate significance thresholds. Simulations with flares injected favour the amplitude maximum deviation as most sensitive at low false detections. Simulations with white and red stochastic source variability favour Bayesian methods. The results are applicable also for the million sources expected in eROSITA's all-sky survey.
AI Key Findings
Get AI-generated insights about this paper's methodology, results, significance, and more — seven facets brought into focus.
Impact
Paper Details
Authors
PDF Preview
Key Terms
Citation Network
Current paper (gray), citations (green), references (blue)
Display is limited for performance on very large graphs.
Discussion 0