TADA is a tablet-based system using touch and audio to help blind and low-vision individuals explore node-link diagrams. It facilitates open-ended exploration, specific node searches, navigation, and information filtering, based on user feedback and tested successfully with 25 participants.
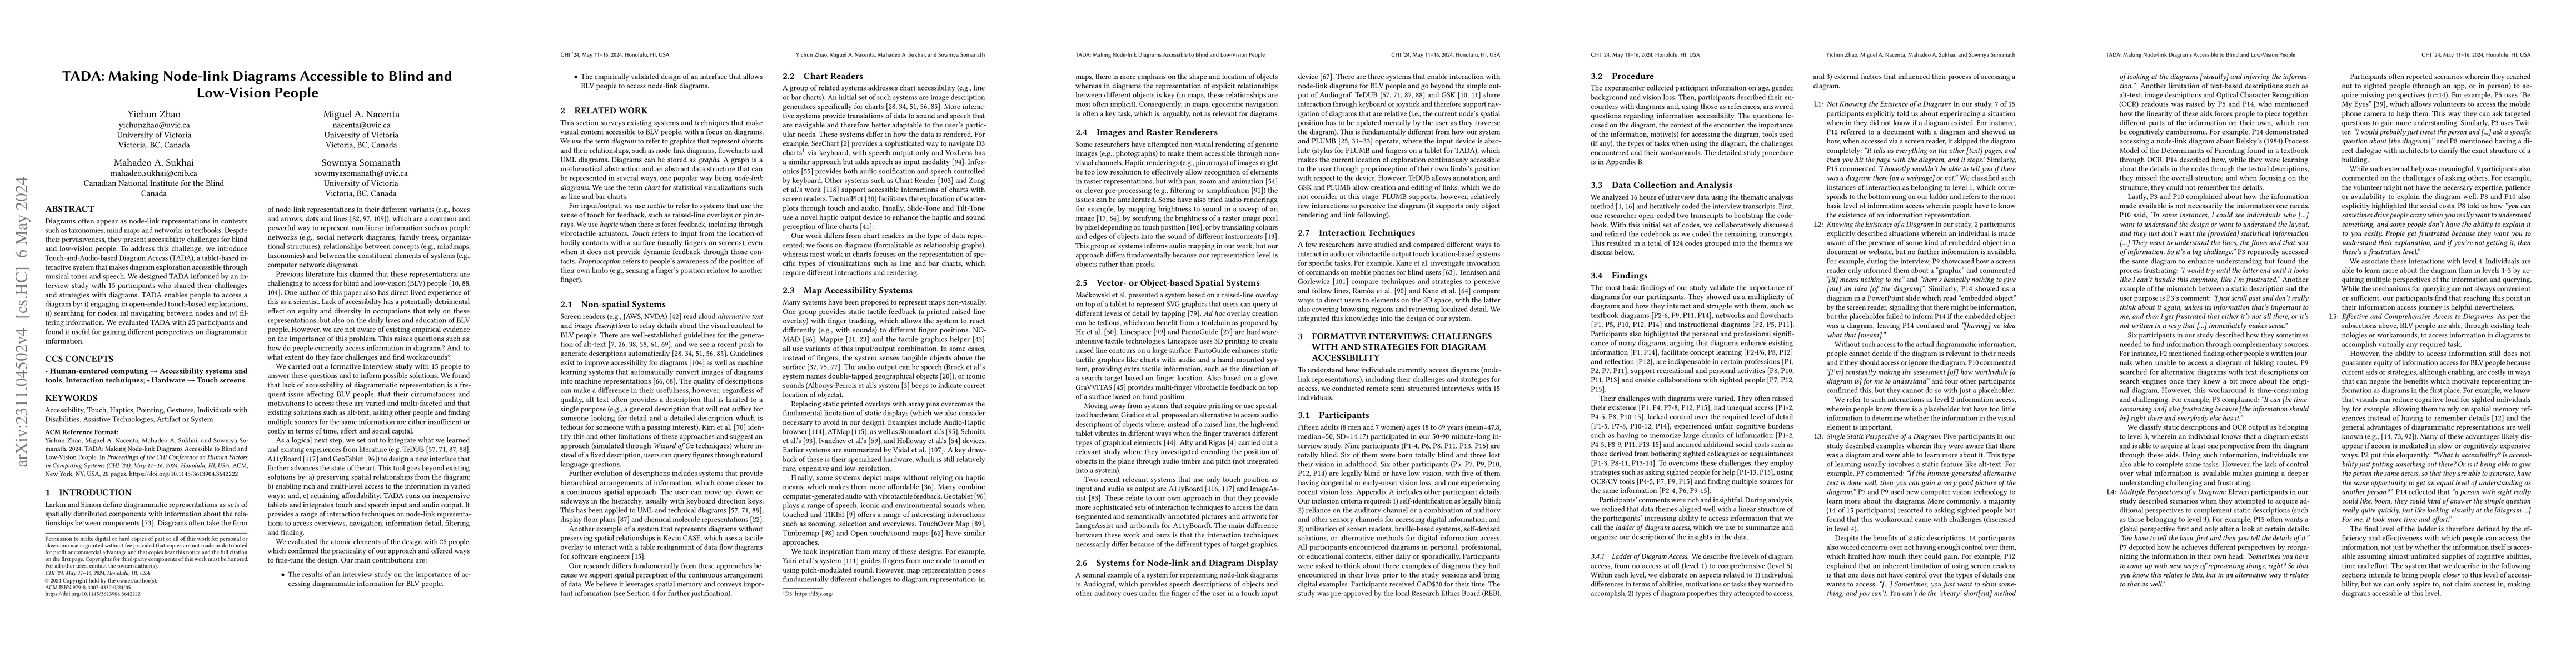
Diagrams often appear as node-link representations in many contexts, such as taxonomies, mind maps and networks in textbooks. Despite their pervasiveness, they present significant accessibility challenges for blind and low-vision people. To address this challenge, we introduce Touch-and-Audio-based Diagram Access (TADA), a tablet-based interactive system that makes diagram exploration accessible through musical tones and speech. We designed and developed TADA informed by insights gained from an interview study with 15 participants who shared their challenges and strategies for accessing diagrams. TADA enables people to access a diagram by: i) engaging in open-ended touch-based explorations, ii) allowing searching of specific nodes, iii) navigating from one node to another and iv) filtering information. We evaluated TADA with 25 participants and found that it can be a useful tool for gaining different perspectives about the diagram and participants could complete several diagram-related tasks.
Get AI-generated insights about this paper's methodology, results, and significance.
Current paper (gray), citations (green), references (blue)
Jazmin Collins, Shiri Azenkot, Crescentia Jung et al.
Mingming Fan, Zeyu Xiong, Zhitong Guan
Danna Gurari, Eunsol Choi, Yi-Hao Peng et al.
Title | Authors | Year | Actions |
---|---|---|---|
Accessibility in conceptual modeling—A systematic literature review, a keyboard-only UML modeling tool, and a research roadmap
|
Aylin Sarioglu, Haydar Metin, Dominik Bork
|
2025
|
View Paper |
ChartA11y: Designing Accessible Touch Experiences of Visualizations with Blind Smartphone Users
|
Zhuohao Zhang, John R. Thompson, Aditi Shah, Manish Agrawal, Alper Sarikaya, Jacob O. Wobbrock, Edward Cutrell, Bongshin Lee
|
2024
|
View Paper |
Grouping Effect for Bar Graph Summarization for People with Visual Impairments
|
Banri Kakehi, M. Iwamura, Kazunori Minatani, Koichi Kise
|
2024
|
View Paper |
Enhancing Virtual Mobility for Individuals Who Are Blind or Have Low Vision: A Stationary Exploration Method
|
Hong Zhao, Oyewole Oyekoya, Hao Tang
|
2024
|
View Paper |
Speech-based Mark for Data Sonification
|
Yichun Zhao, Jingyi Lu, Miguel A. Nacenta
|
2024
|
View Paper |
Tools and Tasks in Sensemaking: A Visual Accessibility Perspective
|
Yichun Zhao, Miguel A. Nacenta
|
2024
|
View Paper |
Title | Authors | Year | Actions |
---|---|---|---|
Show It or Tell It? Text, Visualization, and Their Combination
|
Marti A. Hearst
|
2023
|
View Paper |
Chart Reader: Accessible Visualization Experiences Designed with Screen Reader Users
|
John Thompson, Jesse J Martinez, Alper Sarıkaya, Edward Cutrell, Bongshin Lee
|
2023
|
View Paper |
“Explain What a Treemap is”: Exploratory Investigation of Strategies for Explaining Unfamiliar Chart to Blind and Low Vision Users
|
Gye-Gyoung Kim, Jiho Kim, Yea-Seul Kim
|
2023
|
View Paper |
Exploring Chart Question Answering for Blind and Low Vision Users
|
Jiho Kim, Arjun Srinivasan, N. Kim, Yea-Seul Kim
|
2023
|
View Paper |
A11yBoard: Making Digital Artboards Accessible to Blind and Low-Vision Users
|
Zhuohao Zhang, J. Wobbrock
|
2023
|
View Paper |
How the Alt Text Gets Made: What Roles and Processes of Alt Text Creation Can Teach Us About Inclusive Imagery
|
E. J. Edwards, Michael Gilbert, Emily Blank, S. Branham
|
2023
|
View Paper |
Multimodal Presentation of Interactive Audio-Tactile Graphics Supporting the Perception of Visual Information by Blind People
|
M. Maćkowski, Piotr Brzoza, Mateusz Kawulok, Rafał Meisel, Dominik Spińczyk
|
2023
|
View Paper |
ImageAssist: Tools for Enhancing Touchscreen-Based Image Exploration Systems for Blind and Low Vision Users
|
Vishnu Nair, Han Zhu, Brian A. Smith
|
2023
|
View Paper |
SeeChart: Enabling Accessible Visualizations Through Interactive Natural Language Interface For People with Visual Impairments
|
Md. Zubair Ibne Alam, Shehnaz Islam, Enamul Hoque
|
2023
|
View Paper |
Developing Dynamic Audio Navigation UIs to Pinpoint Elements in Tactile Graphics
|
Gaspar Ramôa, V. Schmidt, P. König
|
2022
|
View Paper |
A11yBoard: Using Multimodal Input and Output to Make Digital Artboards Accessible to Blind Users
|
Zhuohao Zhang, J. Wobbrock
|
2022
|
View Paper |
Animations at Your Fingertips: Using a Refreshable Tactile Display to Convey Motion Graphics for People who are Blind or have Low Vision
|
Leona Holloway, S. Ananthanarayan, M. Butler, Madhuka De Silva, K. Ellis, Cagatay Goncu, Kate Stephens, K. Marriott
|
2022
|
View Paper |
Accessible Interactive Maps for Visually Impaired Users
|
Julie Ducasse, Anke M. Brock, C. Jouffrais
|
2022
|
View Paper |
Rich Screen Reader Experiences for Accessible Data Visualization
|
Jonathan Zong, Crystal Lee, Alan Lundgard, JiWoong Jang, Daniel Hajas, Arvind Satyanarayan
|
2022
|
View Paper |
Representational transformations: Using maps to write essays
|
A. Binks, Alice Toniolo, Miguel A. Nacenta
|
2022
|
View Paper |
Slide-Tone and Tilt-Tone: 1-DOF Haptic Techniques for Conveying Shape Characteristics of Graphs to Blind Users
|
Danyang Fan, A. Siu, W. Law, R. Zhen, Sile O'Modhrain, Sean Follmer
|
2022
|
View Paper |
Infosonics: Accessible Infographics for People who are Blind using Sonification and Voice
|
Leona Holloway, Cagatay Goncu, Alon Ilsar, M. Butler, K. Marriott
|
2022
|
View Paper |
VoxLens: Making Online Data Visualizations Accessible with an Interactive JavaScript Plug-In
|
Ather Sharif, Olivia H. Wang, Alida T. Muongchan, Katharina Reinecke, J. Wobbrock, Jacob O. obbrock
|
2022
|
View Paper |
Towards Understanding Sensory Substitution for Accessible Visualization: An Interview Study
|
Pramod Chundury, Biswaksen Patnaik, Yasmin Reyazuddin, Christine Tang, J. Lazar, N. Elmqvist
|
2021
|
View Paper |
Evaluation of Automated Image Descriptions for Visually Impaired Students
|
Anett Hoppe, D. Morris, R. Ewerth
|
2021
|
View Paper |
Echolocation as a Means for People with Visual Impairment (PVI) to Acquire Spatial Knowledge of Virtual Space
|
Ronny Andrade, Jenny Waycott, Steven Baker, F. Vetere
|
2021
|
View Paper |
PantoGuide: A Haptic and Audio Guidance System To Support Tactile Graphics Exploration
|
Elyse D. Z. Chase, A. Siu, Abena Boadi-Agyemang, Gene S.-H. Kim, Eric J. Gonzalez, Sean Follmer
|
2020
|
View Paper |
Design Guidelines and Recommendations for Multimodal, Touchscreen-based Graphics
|
J. Gorlewicz, Jennifer L. Tennison, Phillip Merlin Uesbeck, Margaret E. Richard, H. Palani, A. Stefik, Derrick W. Smith, N. Giudice
|
2020
|
View Paper |
Transforming Diagrams' Semantics to Text for Visually Impaired
|
Charles D. Cross, D. Cetinkaya, H. Dogan
|
2020
|
View Paper |
Tactile Presentation of Network Data: Text, Matrix or Diagram?
|
Yalong Yang, K. Marriott, M. Butler, Cagatay Goncu, Leona Holloway
|
2020
|
View Paper |
Approaches for diagrams accessibility for blind people: a systematic review
|
M. Torres, Regina Barwaldt
|
2019
|
View Paper |
Visualizing for the Non‐Visual: Enabling the Visually Impaired to Use Visualization
|
Jinho Choi, Sanghun Jung, Deok Gun Park, J. Choo, N. Elmqvist
|
2019
|
View Paper |
Exploring Sonic Parameter Mapping for Network Data Structures
|
Brian Hansen, Leya Breanna Baltaxe-Admony, S. Kurniawan, A. Forbes
|
2019
|
View Paper |
Non-visual Perception of Lines on a Multimodal Touchscreen Tablet
|
Jennifer L. Tennison, J. Gorlewicz
|
2019
|
View Paper |
Vega-Lite: A Grammar of Interactive Graphics
|
Arvind Satyanarayan, Dominik Moritz, Kanit Wongsuphasawat, Jeffrey Heer
|
2018
|
View Paper |
Soundbased Image and Position Recognition System SIPReS
|
S. Uno, Yasuo Suzuki, Takashi Watanabe, Miku Matsumoto, Yan Wang
|
2018
|
View Paper |
Towards a Multisensory Augmented Reality Map for Blind and Low Vision People: a Participatory Design Approach
|
Jérémy Albouys-Perrois, Jérémy Laviole, C. Briant, Anke M. Brock
|
2018
|
View Paper |
Dynamic Graph Generation Network: Generating Relational Knowledge from Diagrams
|
Daesik Kim, Y. Yoo, Jeesoo Kim, Sangkuk Lee, Nojun Kwak
|
2017
|
View Paper |
TacTILE: A Preliminary Toolchain for Creating Accessible Graphics with 3D-Printed Overlays and Auditory Annotations
|
Liang He, Zijian Wan, Leah Findlater, Jon E. Froehlich
|
2017
|
View Paper |
Echolocation in humans: an overview.
|
L. Thaler, M. Goodale
|
2016
|
View Paper |
PictureSensation – a mobile application to help the blind explore the visual world through touch and sound
|
M. Banf, Ruben Mikalay, Baris Watzke, V. Blanz
|
2016
|
View Paper |
Linespace
|
Saiganesh Swaminathan, T. Roumen, Róbert Kovács, David Stangl, Stefanie Müller, Patrick Baudisch
|
2016
|
View Paper |
Tangible Reels: Construction and Exploration of Tangible Maps by Visually Impaired Users
|
Julie Ducasse, M. Macé, M. Serrano, C. Jouffrais
|
2016
|
View Paper |
MapSense: Multi-Sensory Interactive Maps for Children Living with Visual Impairments
|
Émeline Brulé, G. Bailly, Anke M. Brock, Frédéric Valentin, Grégoire Denis, C. Jouffrais
|
2016
|
View Paper |
A Diagram is Worth a Dozen Images
|
Aniruddha Kembhavi, M. Salvato, Eric Kolve, Minjoon Seo, Hannaneh Hajishirzi, Ali Farhadi
|
2016
|
View Paper |
Interactive audio-tactile maps for visually impaired people
|
Anke M. Brock, C. Jouffrais
|
2015
|
View Paper |
The Tactile Graphics Helper: Providing Audio Clarification for Tactile Graphics Using Machine Vision
|
Giovanni Fusco, V. Morash
|
2015
|
View Paper |
Pyc2Sound: a Python tool to convert images into sound
|
Vincent Bragard, Thomas Pellegrini, J. Pinquier
|
2015
|
View Paper |
Ensuring Digital Accessibility through Process and Policy
|
J. Lazar, Daniel Goldstein, Anne Taylor
|
2015
|
View Paper |
Visualization Analysis and Design
|
T. Munzner
|
2014
|
View Paper |
Including blind people in computing through access to graphs
|
S. Balik, Sean P. Mealin, Matthias F. Stallmann, R. Rodman, Michelle L. Glatz, V. Sigler
|
2014
|
View Paper |
Pre-journey Visualization of Travel Routes for the Blind on Refreshable Interactive Tactile Displays
|
M. Ivanchev, Francis Zinke, U. Lucke
|
2014
|
View Paper |
Making Gestural Interaction Accessible to Visually Impaired People
|
Anke M. Brock, P. Truillet, Bernard Oriola, C. Jouffrais
|
2014
|
View Paper |
Interactive Maps for Visually Impaired People: Design, Usability and Spatial Cognition
|
Anke M. Brock
|
2013
|
View Paper |
Multimodal eyes-free exploration of maps: TIKISI for maps
|
Sina Bahram
|
2013
|
View Paper |
A mobile interactive maps application for a visually impaired audience
|
Nikolaos Kaklanis, K. Votis, D. Tzovaras
|
2013
|
View Paper |
Multi-touch rotation gestures: performance and ergonomics
|
Eve E. Hoggan, John Williamson, Antti Oulasvirta, Miguel A. Nacenta, P. Kristensson, Anu Lehtiö
|
2013
|
View Paper |
GSK: universally accessible graph sketching
|
S. Balik, Sean P. Mealin, Matthias F. Stallmann, R. Rodman
|
2013
|
View Paper |
Dynamic Tactile Diagram Simplification on Refreshable Displays
|
Ravi Rastogi, D. Pawluk
|
2013
|
View Paper |
Learning non-visual graphical information using a touch-based vibro-audio interface
|
N. Giudice, H. Palani, E. Brenner, K.M. Kramer
|
2012
|
View Paper |
Mental Map Preservation Helps User Orientation in Dynamic Graphs
|
D. Archambault, H. Purchase
|
2012
|
View Paper |
GeoTablet, une application cartographique pour les personnes déficientes visuelles
|
Mathieu Simonnet, Cécile Bothorel, Luiz Felipe Maximiano, A. Thépaut
|
2012
|
View Paper |
The HapticTouch toolkit: enabling exploration of haptic interactions
|
David Ledo, Miguel A. Nacenta, Nicolai Marquardt, Sebastian Boring, S. Greenberg
|
2012
|
View Paper |
Access overlays: improving non-visual access to large touch screens for blind users
|
Shaun K. Kane, M. Morris, Annuska Perkins, Daniel J. Wigdor, Richard E. Ladner, J. Wobbrock
|
2011
|
View Paper |
GraVVITAS: Generic Multi-touch Presentation of Accessible Graphics
|
Cagatay Goncu, K. Marriott
|
2011
|
View Paper |
TouchOver map: audio-tactile exploration of interactive maps
|
Benjamin Poppinga, Charlotte Magnusson, M. Pielot, K. Rassmus-Gröhn
|
2011
|
View Paper |
Gestures in the wild: studying multi-touch gesture sequences on interactive tabletop exhibits
|
Uta Hinrichs, Sheelagh Carpendale
|
2011
|
View Paper |
Usable gestures for blind people: understanding preference and performance
|
Shaun K. Kane, J. Wobbrock, Richard E. Ladner
|
2011
|
View Paper |
ATMap: Annotated Tactile Maps for the Visually Impaired
|
Limin Zeng, G. Weber
|
2011
|
View Paper |
Timbremap: enabling the visually-impaired to use maps on touch-enabled devices
|
Jing Su, Alyssa Rosenzweig, Ashvin Goel, E. D. Lara, K. Truong
|
2010
|
View Paper |
Audio-Haptic Browser for a Geographical Information System
|
Limin Zeng, G. Weber
|
2010
|
View Paper |
Development of Directly Manipulable Tactile Graphic System with Audio Support Function
|
S. Shimada, Haruka Murase, Suguru Yamamoto, Yusuke Uchida, M. Shimojo, Y. Shimizu
|
2010
|
View Paper |
The Haptic Tabletop Puck: tactile feedback for interactive tabletops
|
Nicolai Marquardt, Miguel A. Nacenta, J. Young, Sheelagh Carpendale, S. Greenberg, Ehud Sharlin
|
2009
|
View Paper |
Investigating touchscreen accessibility for people with visual impairments
|
D. McGookin, S. Brewster, WeiWei Jiang
|
2008
|
View Paper |
Slide rule: making mobile touch screens accessible to blind people using multi-touch interaction techniques
|
Shaun K. Kane, Jeffrey P. Bigham, J. Wobbrock
|
2008
|
View Paper |
Expression of paths and buildings for universal designed interactive map with due consideration for visually impaired people
|
I. Yairi, M. Takano, M. Shino, M. Kamata
|
2008
|
View Paper |
Toward a data sonification design space map
|
A. D. Campo
|
2007
|
View Paper |
Sketching User Experiences: Getting the Design Right and the Right Design
|
B. Buxton
|
2007
|
View Paper |
Graphical Tactile Displays for Visually-Impaired People
|
F. Vidal-Verdú, M. Hafez
|
2007
|
View Paper |
PLUMB:: an interface for users who are blind to display, create, and modify graphs
|
Matt Calder, R. Cohen, Jessica A. Lanzoni, Yun Xu
|
2006
|
View Paper |
Using an audio interface to assist users Who are visually impaired with steering tasks
|
R. Cohen, Valerie Haven, Jessica A. Lanzoni, Arthur Meacham, Joelle Skaff, Michael Wissell
|
2006
|
View Paper |
Nasa-Task Load Index (NASA-TLX); 20 Years Later
|
S. Hart
|
2006
|
View Paper |
Task taxonomy for graph visualization
|
Bongshin Lee, C. Plaisant, C. Parr, Jean-Daniel Fekete, N. Riche
|
2006
|
View Paper |
Teaching graphs to visually impaired students using an active auditory interface
|
R. Cohen, Arthur Meacham, Joelle Skaff
|
2006
|
View Paper |
Providing interactive access to architectural floorplans for blind people
|
H. Petrie, Neil King, A. Burn, P. Pavan
|
2006
|
View Paper |
PLUMB: displaying graphs to the blind using an active auditory interface
|
R. Cohen, Rui Yu, Arthur Meacham, Joelle Skaff
|
2005
|
View Paper |
Automated interpretation and accessible presentation of technical diagrams for blind people
|
M. Horstmann, M. Lorenz, A. Watkowski, G. Ioannidis, O. Herzog, A. King, D. G. Evans, C. Hagen, C. Schlieder, A. Burn, Neil King, H. Petrie, Sijo Dijkstra, D. Crombie
|
2004
|
View Paper |
Multimedia learning
|
Kieran Walsh
|
2004
|
View Paper |
Presenting UML Software Engineering Diagrams to Blind People
|
A. King, P. Blenkhorn, D. Crombie, Sijo Dijkstra, G. Evans, John Wood
|
2004
|
View Paper |
Evaluation of a non-visual molecule browser
|
Andy Brown, S. Pettifer, R. Stevens
|
2003
|
View Paper |
TeDUB: A System for Presenting and Exploring Technical Drawings for Blind People
|
H. Petrie, C. Schlieder, P. Blenkhorn, G. Evans, A. King, A. O'Neill, G. Ioannidis, Blaithin Gallagher, D. Crombie, Rolf Mager, Maurizio Alafaci
|
2002
|
View Paper |
Information Visualization
|
Robert Spence
|
2000
|
View Paper |
Information Visualization: Perception for Design
|
2000
|
View Paper | |
Transforming Qualitative Information: Thematic Analysis and Code Development
|
R. Boyatzis
|
1998
|
View Paper |
External cognition: how do graphical representations work?
|
M. Scaife, Y. Rogers
|
1996
|
View Paper |
Audiograf: a diagram-reader for the blind
|
Andrea R. Kennel
|
1996
|
View Paper |
The non-designer's design book: design and typographic principles for the visual novice
|
Robin Williams
|
1994
|
View Paper |
An evaluation of earcons for use in auditory human-computer interfaces
|
S. Brewster, Peter C. Wright, A. Edwards
|
1993
|
View Paper |
Understanding charts and graphs
|
S. Kosslyn
|
1989
|
View Paper |
Why a Diagram is (Sometimes) Worth Ten Thousand Words
|
J. Larkin, H. Simon
|
1987
|
View Paper |
American Foundation for the Blind
|
1967
|
View Paper | |
2023. GPT-4 Technical Report
|
2023
|
||
Unity Technologies
|
2023
|
||
Data sonif-cation: Sounds from around the milky way
|
2020
|
||
Image Description Guidelines
|
2019
|
||
Chunity: Integrated Audiovisual Programming in Unity
|
Jack Atherton, Ge Wang
|
2018
|
View Paper |
W3C Web Accessibility Initiative (WAI)
|
2017
|
||
Graph Markup Language (GraphML)
|
U. Brandes, Markus Eiglsperger, J. Lerner, Christian Pich
|
2013
|
View Paper |
Interactively Displaying Maps on a Tactile Graphics Display
|
Bernhard Schmitz, T. Ertl
|
2012
|
View Paper |
A qualitative approach to HCI
|
2008
|
||
Visual and proprioceptive representations in spatial memory
|
Naohide Yamamoto, A. Shelton
|
2005
|
View Paper |
Exploring the use of structured musical stimuli to communicate simple diagrams: the role of context
|
J. Alty, D. Rigas
|
2005
|
View Paper |
ChucK: A Concurrent, On-the-fly, Audio Programming Language
|
Ge Wang, P. Cook
|
2003
|
View Paper |
Using speech and touch to enable blind people to access schematic diagrams
|
P. Blenkhorn, D. G. Evans
|
1998
|
View Paper |
Deictic Codes for the Embodiment of CognitionDana
|
H. Ballard, M. Hayhoe, P. Pook, N. RajeshP., RaoComputer
|
1995
|
View Paper |
Development of NASA-TLX (Task Load Index): Results of Empirical and Theoretical Research
|
S. Hart, L. Staveland
|
1988
|
View Paper |
NOMAD”: An audio-tactile tool for the acquisition, use and management of spatially distributed information by partially sighted and blind persons
|
1988
|
||
Proceedings of the SIGCHI Conference on Human Factors in Computing Systems, CHI 1985, San Francisco, California, USA, 1985
|
1985
|
View Paper | |
Be My Eyes
|
|||
2022. Communicating Visualizations without Visuals: Investigation of Visualization Alternative Text for People with Visual Impairments
|
|||
IX. Whatmediawasthe informationpresentedin?Wasitprinted, electronic, verbal, or other?
|
|||
VIII. What was the surrounding physical environment? For example, was it public or private? Was it personal or professional?
|
|||
element is important
|
|||
j1mmyto9. 2022. Speed to text in Unity iOS use Native Speech Recognition
|
|||
How did you try to address these challenges, if at all?
|
|||
L1: Not Knowing the Existence of a Diagram : In our study, 7 of 15 participants explicitly told us about experiencing a situation wherein they did not know if a diagram existed
|
|||
XIII. What were the main challenges that you encountered when trying to access the diagram?
|
|||
X. What did you do when you accessed the information? What tools did you use to access the information, if any?
|
|||
III. To which degree were you successful in accessing the diagrammatic information?
|
|||
2022. Guidelines for Creating Image Descriptions
|
|||
Support Multiple Levels of Information Access : Our interviews showed that people have diverse varying circumstances and motives to access diagrams.
|
|||
CHI ’24, May 11–16, 2024, Honolulu, HI, USA
|
|||
2023. TactualPlot: Spatializing Data as Sound using Sensory Sub-stitution for Touchscreen Accessibility
|
|||
2022. Accessibility of Linked-Node Diagrams on Collaborative Whiteboards for Screen Reader Users
|
|||
Making Node-link Diagrams Accessible to Blind and Low-Vision People interaction with mobile devices and services
|
Showing first page preview. Click "Open Full PDF" to view the complete paper.
Your comment contains inappropriate language and has been rejected.
Are you sure you want to remove this tag? This action cannot be undone.
Someone just favorited a paper!
Comments (0)